Tuesday, April 19, 2011

Still Bearish QQQ going into end of QE2!!!

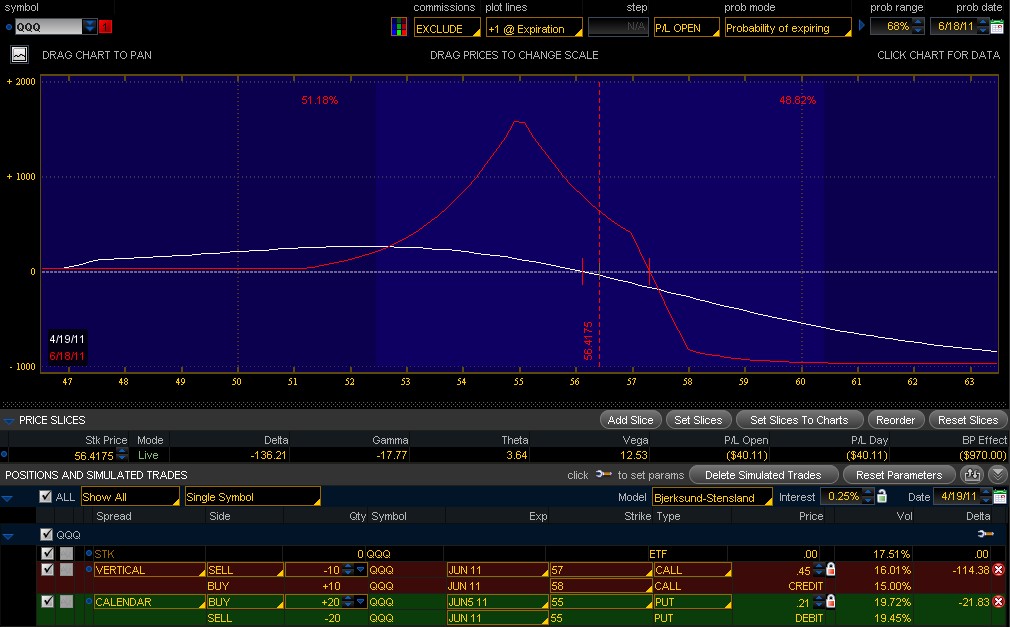
As I commented on my previous trade that I closed out, I mentioned that I would be looking to get back into a trade in the QQQ to the short side using June options. Today the VIX has pulled back a ton, giving back all the gains from just a day ago. So I sold 10 Jun '11 57/58 callspreads for $0.45, or $450. I also bought 20 Jun '11 Quarterlies/ Jun '11 Calendars -->buying the quarterlies and selling the Jun regular expiration options. I put these on for $0.21 debit or a total, $420. So my total risk for combined positions is $970, with total upside of about $1650.


Above is my aggregated risk profile.

I like the calendar using the $55 strike because I still have a target of around $54-$55 on the QQQ and I like the additional upside for an uptick in Volatility. So I may peal pieces of this off on any spike in volatility, which I think we will be seeing more of as we move closer to the expiration of QE2. I sold the callspreads to finance the calendars, but also sold them believing that QQQ will not get above the downtrend line that I have drawn in the above chart. I would probably close this position if we breach and close above my trendline on a daily chart.

I will keep you guys posted.

Monday, April 18, 2011

Going from bearish to neutral on bonds (ZB)

Long before I ever subscribed to technical analysis I got by for many years on instinct, intuition, The Force, whatever you want to call it. I've been playing ZB for four months now using TA around the fundamental forces behind the interest rate/inflation story. Last week I closed out of some short ZB and felt like I was at a reset moment. I was still short some OTM calls that didn't expire for two weeks but at the time they were a full 3'00 OTM and I wasn't ready to close out early yet, other than those I was ready to reset. I've been watching the ZB chart like I watch TV for a while now and all I can tell you is that my gut instinct says something has changed. I got short one contract on Friday simply because we were up 3'00 in three days, that's good enough for me to take a short-term downside shot. But after watching the combination of price and volume after I entered  my trade I felt something has changed. In watching the BxA sizes I noticed that there was a larger bid under bonds than in the past, I normally don't pay attention to this but it was the first sign that something was different. I've been trading off the JUN contract chart ever since we rolled and not the aggregate chart. The trading range on these are different depending on what you're looking at. So the JUN contract ZBM1 that has been very technically sound told me to get short at 121, I did, but my gut said this wasn't holding. So I backed out to the aggregate chart and the top of the range there is really 122, but I don't feel comfortable with that either right now.


So adhering to what got me to the dance I listened to my gut an put in an order over the weekend to hopefully get out on Monday and I got lucky with this S&P announcement this morning that temporarily caused a 1'00 sell off. We spent the rest of the day today recouping that loss. So one of the major ratings agency does the previously unthinkable and publicly calls out the US on its debit/credit rating and the market shrugs it off after an hour? This confirms for me that at least temporarily there is a bid under bonds right now. As a trader I have to be willing to throw my bias over board and just listen to the market. In the past I've posted here that I'm willing to be short up to 5 contracts at 122'00 with no hedge because I would double down at 125'00, I'm changing that and now taking my short size down to 3 contracts at 122'00 and I'm going to use a stop, and if I add to this position it's probably going to be in the form of an OCO order where I scale in to shorts near 122 but have a tight stop. I absolutely still believe in the inflation/interest rate fundamentals long-term, but I'm trading for short-term profits, not investing with biases and waiting around long-term to hope it comes true.
ZBM1 JUN Contract: Trading Range 118-121


Aggregate Chart: Trading Range 118-122


 ZB Trade: Entered Friday, exited this morning


The probable OCO order that I'll use when we hit 122. I'm willing to risk a quarter point (0'08 to make 3'00), so 12:1 risk/reward. I intend to stagger my OCO orders and not put them all in at the same prices. This way a spike trade past my stop loss doesn't exit all my positions. If these all get run and my stops are hit, I'll use this same trade strategy but with a larger size as we approach 125. That is where I'm willing to stay short longer term and absorb the pain of being wrong.

Saturday, April 16, 2011

April 2011 Options Expiration Results

By one measure this was my best ever month financially, but just as I felt that last month's tally of $575 didn't paint the whole picture, I also feel this month wasn't as good as it looks. Though I've had bigger recorded gains in a month before, most of those gains were from long-term spreads that were building in value over time and finally got recorded in the month they were closed out; where as all of this month's gains were derived within the April options expiration cycle. So I am excited to book $11,357 in gains derived from the last few weeks of trading, but the instruments and leverage involved has to be kept in context. Up until about six months ago I was almost exclusively an equity options premium seller, now I'm also trading futures and these cut both ways. Last month I only had a few losing trades, but two futures trades in particular almost completely wiped out about 15 winning equity option trades. This month my futures trades went my direction so the gains look big in comparison.

The Nat Gas profit of $3,042 this month needs to be held in context with the ($2,306) loss I took on that trade last month. In my view this was a rolled contract with a net gain of about $700 over a two month period. And though I'm very happy that my short bond futures paid off over $8,000, that trade could have also moved against me and I'd be sitting on a large MTM loss right now. I color coded my trades again for me to analyze more than just the bottom line profit or loss. I'll go back at the end of the year and maybe create a pie chart or something to breakdown the performance. I had a few scratch trades this month where I either decided against them shortly after or tried to exit for a few pennies above trade price to cover commissions. Though the net result is near zero and I don't like to incorporate scratch trades in to my performance, I also don't want to omit them from the record.

I also fell in to an old bad habit this month and got away from my game plan a bit. Since I had a large position in bond futures I found myself watching the chart literally every 20 minutes or so whenever I was awake. Since futures trade almost 24 hours I find it hard to ever stop thinking about it. So we had a relative dead spot for a few days where ZB traded in a small range, when you're watching every few minutes two days of small movements feels like forever. So I entered a few trades that didn't make sense for me as I was just feeling the need to try and make something happen rather than just be patient. I did recognize this behavior shortly after as I try to objectively analyze my positions each night. So I admitted the errors to myself and exited the trades soon after. I won't go in to detail on each mistake but let's just say this was the only thing keeping me from a perfect performance and admitting this would have otherwise been a phenomenal month for me. So my record shows that quantitatively I am getting better, I'm more efficient with using my capital, better trade entries/exits, better risk/reward management, but I also still have a lot to work on and I'm mindful of that.

 April 2011 Options Expiration Results

Updated Historical Results

Current positions heading in to May 2011 expiration cycle

E-mail: JasonAndrewHaas@aol.com

Follow JasonAndrewHaas on Twitter

VIX Options Trading Experience

A few weeks ago I traded my first VIX options. I just thought that with VIX at 17 and its relative lows at about 15 that I would sell some 17 strike puts. My feeling was I could just roll out to the next month and down to 16 if it went below 17. So that theory is flawed for a few reasons but the main thing I didn't consider was that below 17 there isn't really any premium to be had because it historically doesn't trade for much less, which makes sense as the reason I was interested in selling puts in the first place was that VIX doesn't normally trade this low and can't go to 0. The reason I exited the trade was with about six days left until they expired they were still trading .05 away from where I entered, but VIX was also trading about the same place and the next month options didn't look very enticing.

I took a look at the option chain and the price for the 17 put is about the same. So this made no sense to me for the weekly and monthly premiums to be near equal. The bid for the 16 put was .05 so that threw that theory out the window of rolling down to a lower strike. I also did not notice when I sold to open for .25 that these only trade in .05 increments. Last trade was showing .18 so I tried to pay that to close and TOS kicked the order out as invalid. So now I'm pissed that the chart is showing trades going through at prices other than .05 denominations so I decide this instrument sucks ass and there are better ways to play volatility. So I got out with a small $35 profit after fees but learned another lesson, which is great. I'm a big proponent of continually trying to trade with new instruments or ideas using small position size in order to gain the learning experience with real money instead of paper trading. I started small trading bond futures in November not having a clue how they worked and now I fully understand and I've booked $25,000 in profits. VIX options are not for me so I'll move on and dabble with something else.

VIX Option Chain: Last Trade shows .18 on the APR 17 Puts

Chart of APR 17 Put Trade Prices: Why are trades going through at other than .05 increments but TOS won't let me do it?

Long-Term VIX Chart with relative lows of near 15

Close Out Trade


Thursday, April 7, 2011

IV Charts on Think or Swim vs LiveVol

So since the free version of LiveVol is no longer, I have been using the TOS platform to get a visual even though I don't like it compared to what I'm used to at LiveVol. But today I pull up IV on TOS for (RMBS) and I know by eyeballing it that it's not correct because I've been following my APR position daily and taking a look at MAY periodically as well. So I pull up the option chain to see what that says versus the IV chart and I confirm that it's wrong. Then I use LiveVol and that chart looks correct to me from what I've been seeing the last few weeks, and also matches the option chain information. Here is my question, why are they different? Does anybody know what the IV is measuring on TOS? Can I check it, change it, etc.? I don't want to pay for LiveVol but if I can't rely on TOS then I have to look elsewhere. IV on TOS is showing 84, that is not correct, how do I find out where they got this from?