Tuesday, August 31, 2010

AKAM close out

I kind of lost my will to be in this position. Besides breaking its uptrending channel and making a series of lower highs, it doesn't pay a dividend. So arguably I should have only been in it using a spread and not cash secured puts as I really wouldn't want to own. It's a bit too volatile for me. I sold to open at .45 and just closed out for .27. That's only $165 after commish and not the $400 I was hoping for. But not bad considering I got short Wednesday at the close. 


Monday, August 30, 2010

SPY Weekly Trade

Heading in to the week I was short-term bullish, but since I already had bullish exposure via naked puts on MCD, AKAM, PM, and naked calls on VXX, I was content to just sit on what I had and not take on any more bullish exposure. It turns out the market doesn't care what I think and when SPY failed exactly at the trend line today I waited a bit to see if that held. I ended up shorting (20) SPY 110 Weeklys at .10. The odds of finishing ITM were less than 10% and return on BP is (200/9000) = 2.2% for 4.5 trading days. I'll take that risk. We would need a greater than 4% move before I start to incur losses. If that happened I would look to roll the trade and sell more OTM SPY calls or maybe even a weekly call spread for next week. We've been in a down trend channel all day since hitting the longer term downtrend.


Trade Update 9/2/10
I've most likely got my hand caught in the cookie jar here. Though these weekly options that expire in less than 24 hours are still .50 OTM, the trend up is currently squarely against me at the moment. I don't however want to close out early and pay for something that will be worth nothing literally in 22 hours. So this is going to be a last half-hour decision if these are ATM or ITM. If ITM, it will depend on by how much. My preference would be to roll them out a week and up another strike to 111. Depending on what prices are at the time of decision, I might also walk them out two weeks and two strikes to normal SEP OPEX at 112. If I had to take on a short position I would feel  much more comfortable shorting near the top of this range. If the range broke above 113 I would most likely have to stop playing this game and take a loss. Below are the option chains for the week that expires tomorrow, next week, and the SEP OPEX. As long as we don't finish at 110.50 or higher tomorrow, I'm comfortable with my options of walking these out. If tomorrow is a big up day I might be stock with a short position, we will see. The good news is I dealt with this same situation last month so this time it's not screwing with my head nearly as much. 


Trade Update 9/3/10
Today has been a wild ride as there were times this trade was very negative, and times it was set to expire worthless or slightly profitable. My preference would have been to take a small loss and end it, but I wasn't afforded that luxury. At 110.30 I rolled half this position out to next week and up two strikes from 110 to 112. This was a break even transaction so I bought myself some time and some upside. I'm much more comfortable being short at 112 than 110. However, I bit off more than I was comfortable with once the position did get in trouble, so I cut my size in half and took a loss on the other half. I paid .82 to close these out when SPY was at 110.77 roughly. The trend was up all day since retracing half of the gap open. The opportunities for walking this trade out to next week got less attractive the higher SPY went. So I've booked a loss of -720. Certainly not happy about it but it's not a game changer. It will just dent my monthly gain down to something not so attractive. And I've still got risk out there on this with 10 short at 112. This was my first foray in to weekly options and it was something I had been wanting to dabble in. I already know that had these expired worthless I would have done it again, and again, until I got burned. So in a way getting burned big enough to hurt and slap myself on the wrist was good. 

There is also another learning experience. Part of the reason I wasn't afraid to short weekly options was I felt my prior experience being short and looking for ways to managed the position and later analysis of that trade, had somehow better prepared me for when it happened again. So yes I can completely hedge this trade with getting long the ES, however, that also comes with additional risk. Check out the chart below. This morning I was left having to gamble on if I should do a preemptive move and buy ES to hedge before the unemployment number came out. I felt this was foolish as I have zero idea what the numbers would be or how the market would react to it. And once they were announced there was no longer time to hedge and we jumped 10 points which effectively took the SPY from 109.50 to 110.50, from .50 OTM to .50 ITM. So lesson learned, on this particular type of short trade the risk isn't worth the reward as once it becomes an actively managed position with hedging it also comes with additional risk. I should stick with defined risk/reward trades as this fits my personality style more. I can always size up or down and make that defined risk/reward large or small to fit my appetite for risk.


Long interest rates for September via TBT

Again I am keeping my positions very small but managable. After the rally in equities that happened on Friday we saw a huge selloff on the TLT. Today the markets are giving back some of those gains and we are getting a pop in the TBT which is a double inverse of TLT.


This morning I sold 1 Sep '10 $30 put at $0.72, which at initiation TOS is showing a 38% chance of expiring ITM. The breakeven on this is 29.28 with the lows put in last week at 29.77, I will re-evaluate if these lows are broken.

Sunday, August 29, 2010

Market Wrap Up/Weekly Preview

Today I decided to put down in writing the culmination of the weekly information inputs I use to try and judge what is going on, and how to try to profit from it. I have to say this experience was similar to writing out formal trade ideas for the blog in that not only was it a good learning experience, but I also enjoyed it. I typically kind of make mental notes of things during the week and once the markets are closed over the weekend I am able to piece things together and then look for opportunities accordingly. I like the written document and will experiment with it going forward. I want a full disclaimer in that most of what is below is not original content and not intended to be so, but rather its my way of aggregating much of the data/info I come across during the week in an attempt to make some useful sense of it.


Weekly Wrap-Up Report
Week ending 8/27/10

Indexes: DOW finished down for a third straight week, a Friday rally left it above the psychologically important 10,000 level, but certainly not looking like its in a position of strength. It has some downside to about 9760 before it would test its support line. SPX bounced convincingly off its support once again at 1040. As you would expect this also correlated with a pull back in VIX and sell off in bonds. It’s yet to be seen if this is just a technical bounce, small relief rally, or confirmation that we’re still range bound.


Technicals: see charts above.

Volatility: Remains range bound from 22-28, with a strong move towards its lower range as the markets rallied on Friday. A break below 20 and I would be looking to either get long VOL or perhaps just sell OTM puts betting against continued complacency.


Correlations: During times of crisis or just short-term spikes in volatility we often see stock correlation heading towards 1.0. However, short-term spikes aside, correlations look to be in a long-term uptrending channel starting sometime in the mid 90’s. Historically when this indicator is below 50% you’ve got a better market to pick individual stocks. Conventional wisdom suggests this increasing correlation is primarily due to culprits such as the prevalence of ETFs (which tends to make large basket of stocks all move in one direction), and lower commissions/easy/quick access to market liquidation. The important point to me is that individual stock picking is becoming tougher, meaning that market timing becomes all the more important. Buy and hold seems to be dead and trading ranges seems to be in if you’re looking for profits. While the recent decline in the number of hedge funds can partially be blamed on deleveraging and the financial crisis, I can also make an argument that increasing high correlation makes their traditional model of heavy research and precise stock picking a bit outdated.

Sentiment: See below

Equities: In addition to favorable technicals for short-term bullishness, the percentage of stocks above their 50DMA is at the lower end of its range for the last 12 months, and sentiment is near the March 09 market lows. These are all indicators that I would be short-term bullish. 


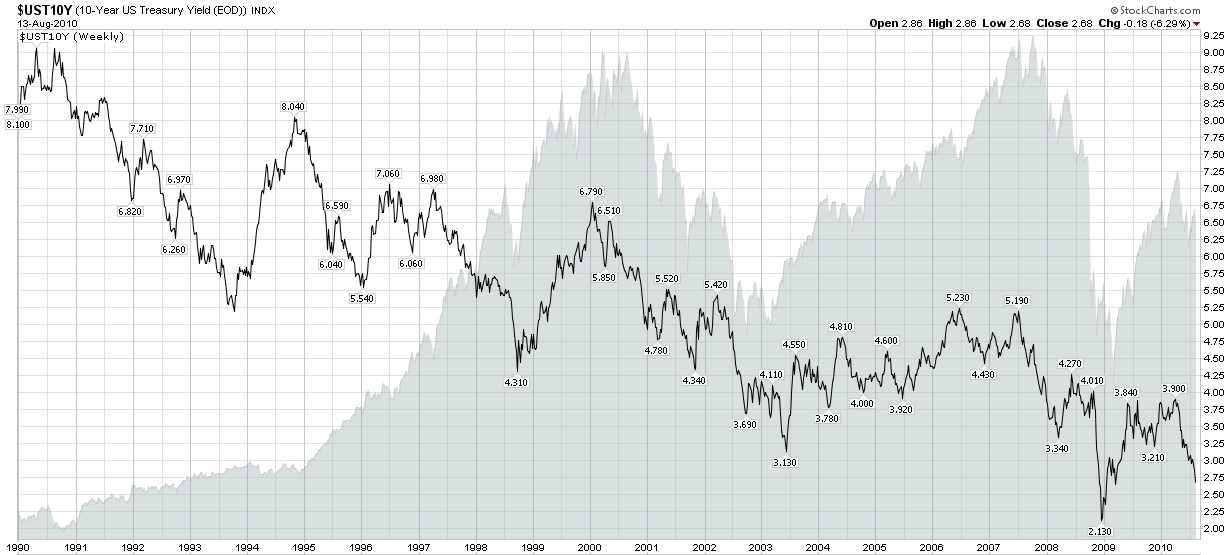
Bonds: The yield curve has been slowly flattening during the time the general equities market have remained range bound. The prevailing theory is that there will be little growth and possibly even deflation, thus even these historically small yields could potentially be a great overall return should we face deflation. Friday saw a large one-day widening of yield curves, which his highly correlated to the one-day bullish reversal we saw in equities. The two and 10-year yields recently hit all time lows, surpassing the 08/09 financial crisis when people flocked so heavily to treasuries. In a relatively stable period of volatility, bond yields are either an opportunity or great cause for concern.

Commodities/Currencies: I do not have enough experience in these areas to incorporate anything in to this report. This is an area I need and plan to educate myself further in as I am starting to understand their overall importance due to market interconnectedness. However, the chart below shows that even a basket of commodities as an asset class is also trading in high correlations lately. This is not consistent with historical norms.

Macro News: GDP revised down from 2.4% to 1.6%, but better than the expected 1.3%. This is kind of in line with what equities seem to be signaling, which is that things are bad, but maybe not horrible. The question remains unanswered as to how much of this recent growth is synthetic via stimulus or authentic via natural demand.

Fed: Stands ready to accommodate further in a yet unspecified manner. Regardless of your political stance on this happening, this could be viewed as bullish since equities stand to gain from more interference. This could also be viewed as bearish since its obvious that the economy seems in need of some help. Rates to stay at 0% indefinitely.

Politics: Part of this range bound market might be due to investors waiting to see the outcome of November midterm elections. A Republican victory in the House or Senate would most likely lead to the extension of the Bush tax cuts on dividends and capital gains. This would most likely be bullish for stocks. If the Democrats hold both houses of Congress this would most likely be bearish for stocks as the street seems to think Obama is not business friendly and would not feel compelled to extend the Bush tax cuts.


M&A Activity: Whether it’s the HP/Intel bidding war or the 30% bid up on Potash, it looks like cash rich balance sheets are trying to find growth externally since internal demand growth prospects are very suspect. The key to both these deals is the street seems to think that both are priced too high, with the only winners being the people who own stock of the companies being acquired. If we start to see more of this activity, then we’ll know corporate America genuinely does not see authentic demand in the near future. Taken in context of this week alone there is nothing to glean here. 

Market Preview for Week 8/30/10 – 9/3/10

Looking to see if bullish engulfing candle that materialized last Friday on most indexes receives confirmation. The market has seen nothing but terrible news with the only bright spots being that initial unemployment claims were not as bad as feared but still not good either, GDP revised downward but again not as bad as feared, and getting a bounce at a technical level. My point is that there is more than ample news for the market to sell off but it has yet to do so, and it’s still within the last five month trading range of SPX 1040-1130. The risk/reward at the moment favors getting a bit bullish for the short-term. I have already sold OTM puts on selected names and I would look to sell OTM call spreads should this bounce take us towards the trading range highs. I look to remain largely in cash while taking selective shots where I see opportunity, while waiting for a more definitive time to increase my exposure in either direction.


CBOE Implied Correlation Index

I had never heard of the CBOE Implied Correlation Index before. It looks like its been out for a little over a year. It's something I plan to keep an eye on and use in my basket of inputs to try and gage market conditions.

Cut and Paste from CBOE below


The CBOE S&P 500® Implied Correlation Index

The CBOE S&P 500 Implied Correlation Index is the first widely disseminated, market-based estimate of the average correlation of the stocks that comprise the S&P 500 Index (SPX). Using SPX options prices, together with the prices of options on the 50 largest stocks in the S&P 500 Index, the CBOE S&P 500 Implied Correlation Index offers insight into the relative cost of SPX options compared to the price of options on individual stocks that comprise the S&P 500.
  • CBOE began disseminating daily values for the CBOE S&P 500 Implied Correlation Index in July 2009, with historical values back to 2007.
  • CBOE calculates and disseminates two indexes tied to two different maturities, usually one year and two years out. The index values are published every 15 seconds throughout the trading day.
  • Both are measures of the expected average correlation of price returns of S&P 500 Index components, implied through SPX option prices and prices of single-stock options on the 50 largest components of the SPX.
  • Ticker symbols JCJ, KCJ and ICJ:
    • JCJ - calculated through Nov 2010 expiration, using Dec 2010 SPX options and Jan 2011 equity LEAPS options
    • KCJ - calculated through Nov 2011 expiration, using Dec 2011 SPX options and Jan 2012 equity LEAPS options
    • ICJ - will be added in Nov 2010 using Dec 2012 SPX options and Jan 2013 equity LEAPS
The CBOE S&P 500 Implied Correlation Index may be used to provide trading signals for a strategy known as volatility dispersion (or correlation) trading. For example, a long volatility dispersion trade is characterized by selling at-the-money index option straddles and purchasing at-the-money straddles in options on index components. One interpretation of this strategy is that when implied correlation is high, index option premiums are rich relative to single-stock options. Therefore, it may be profitable to sell the rich index options and buy the relatively inexpensive equity options.
"One of the perceived benefits of owning a portfolio of stocks is diversification related to the correlation between stocks. While less correlation between stocks in a portfolio typically leads to greater diversification, the correlation between stocks is constantly changing, and in times of market stress the correlation increases as stock prices tend to move together. As a result, the diversification benefits of a portfolio of stocks may be less than initially anticipated."
--- Joe Levin, CBOE Vice President of Research and Product Development

Friday, August 27, 2010

Bullish Engulfing Candle? I have no opinion

Income trades for September

On Wednesday with the SPX approaching the lower end of the recent range near 1040, I decided to get cautiously bullish by selling some OTM puts on names I would like to own on a pullback, assuming the pullback doesn't turn in to a crash. I also sold some upside calls on VXX as without another new shoe to drop in the next three weeks (which absolutely can happen) this too is a pretty conservative gamble. I was just looking to put on what I consider to be some low risk trades to generate some income while I have my mind on a job search here in Chicago. The  plan is to continue bringing in something to contribute towards expenses while I find a job and the get more aggressive deploying capital once I'm comfortable psychologically.

Below are the trades and charts, best case scenario on these is roughly $1100 assuming setting GTCs at .05 and commissions. Worse case scenarios are theoretically unlimited. I'm also scalping the ES for peanuts when I'm bored and have a few victories this week. Initial BP used for all is about $12,500, but I consider these cash secured puts which is a commitment to use $155,500 on the three puts, and unlimited on the VXX calls should we crash.

Sold (10) AKAM 40 puts at .45
Sold (10) MCD 67.50 puts at .25
Sold (10) PM 48 puts at. 31
Sold (10) VXX calls at .26


Thursday, August 26, 2010

Follow up to RBOB Futures trade!!!

As I commented on my RBOB futures trade, I was stopped out but felt good about the trade in general. I wanted to take a moment to put into perspective what I was seeing on the chart and what indicator I just added to my arsenal as a confirmation to what I saw on the chart.

If you recall, the primary reason that I put on the trade was do the fact that I thought it was oversold as it had been down 12 of the last 14 session when the trade was initiated. Today I added the RSI (relative strength index) to my charts as a confirmation for such oversold/overbought conditions.

I am not one to add tons of indicators to my charts as I like to keep things pretty simple. But I really like this one and I like the methodology behind it.

So anyways lets take a look at the chart:


Notice the RSI indicator on the bottom of the chart screen shot. As you may or may not know, as the RSI approaches 30 it indicates oversold conditions and may indicate a relief rally is coming, and as it approaches 70 it means the opposite. So you can see that this indicator would had been confirmation to my thesis had I had it on my chart.

Looking back it looks like my stop was just a little too tight for this trade as I got shaken out just below my stop of 1.7950 only for it to do exactly as I predicted.

Anyways I just thought I would share what I was thinking.

Tuesday, August 24, 2010

ES after hours trade

I've noticed that the ES tends to trade in a narrow range in after hours, presumably due to lack of volume. In my opinion support/resistance lines on the ES in after hours have seemed to be pretty reliable for a technical trade. Since my overall market bias is down and I'm not afraid of a sustained market bounce, I'm going to short ES here and look to scalp a few points before morning, will put a GTC in at 1050. If it breaks resistance above I will not close out for a loss but rather pucker up and keep my GTC on.


New Futures trade in RBOB

I have been pretty bearish on equities and oil related commodities for the past two weeks. The markets have seen a sizable pull with SPY testing 113 on 8/9 only to be rejected to trade lower, hitting an intra day low of 104.97, that is about a 7% move. The important level that people were watching for was the 104.5 to 105 level on the SPY. Once this level breaks the June low of 101.13 is game on. But today the market voted with its wallet and said it was not ready for this move just yet. I think the market has to digest this latest move before moving lower. The market is a bit oversold by my observation.

Trading in lockstep and even suffering steeper losses were Crude and RBOB. Crude has traded down 12 out of the last 14 sessions and RBOB down 12 of the last 15 sessions. Again I am sensing some overbought conditions. Although I remain bearish on most asset classes in the medium term, short term I am ready to take a low risk high reward trade to the upside in RBOB.


Being that I am playing a bit with fire, I am going to keep a tight stop on this one. In today's regular session RBOB traded as low as 1.8010 which in previous analysis I have identified as a potential support level due to the volume clustered around this price and the fact this level was supported in the last half of 2009. It is not a huge level, but I think coupled with the oversold conditions the setup looks good.

So today I bought 5 Oct RBOB contracts at 1.8145 and put in a GTC sell order at 1.7950 As you can see on the chart above I think there is a good chance that RBOB trades back up to around 1.885 where it gapped down from. I am risking 2cts to make 7cts. But the trade is not as simple as that.

In addition to the stop loss order I have out their I also placed another GTC order to sell 2 contracts at 183.50. At this point if these two contracts get taken I will move my stop up to break even on the remaining 3 contracts from 1.7950 to 1.8150. At the same time as moving up my stop loss to break even I will put in another order to sell the remaining 3 contracts at 1.8850.

Seeing as this contract trades in a multiple of 42,000 gallons per contract, if everything goes as planned I am looking to make a maximum $1,680 on the first two contracts and $8,820 on the other three for a total of $10,500. My risk is about 2cts a contract for a max loss of $4,200.

Risk/Reward :    1/2.5

First Trade in New Job!

Yesterday marked my first day of trading in the new position. For my first trade I sold an Iron Condor on RBOB

I sold 31.96/2.00/1.80/1.76 October Iron Condors. These options expire on 9-27-10, leaving about 35 days to expiration. I collected .0215 from the sale. The multiplier on the RBOB contract is 42,000 gallons. So I collected a total of $2,709 on a risk of $5,040, or 54% on risk.

I profit on this trade in the range of 1.7785-1.9815, a 20ct range.

I will keep you posted.

Sunday, August 22, 2010

Gamma...Summarized!

Here is the 2nd of 4 series on the Greeks from Dan Passarelli's book:

Gamma is the second derivative of price or put another way is the first derivative of delta. It is the rate of change in delta for every $1 move in the price of the underlying.

Saturday, August 21, 2010

Delta summarized

I am reading through Dan Passarelli's book for a second time now. I feel like I have a good understanding of the Greeks, but I want to internalize them and will do this in a series of posts. Below is visual diagram that I put together to help internalize Delta and how it changes in relation to time, volatility, and price.


This is the best and most effective visual that I can come up for the way my brain processes information. I want to have this diagram ingrained in my head like I do for the different strategies. Look for future posts in the coming weeks on Gamma, Theat, and Vega.

Friday, August 20, 2010

AUG OPEX Trading Results

This month's negatives are that I made one mistake that cost me $35, and was impatient and deviated from another trade for no apparent reason other than I was skittish that day. But I also ended up overall positive this month instead of negative because I didn't panic and close out my trades when the market moved against me, which is something I've done in the past. So, psychological victory along with monetary victory is good. I attribute the ability to sit on losing trades without panic to a combination of small position size, defined risk, and conviction in my initial trade ideas. Last month I felt I over traded and ended up losing money. This month I was really hands off and ended up doing well given the amount of risk taken. $1666 doesn't pay the bills, but I'm building towards a long-term goal which is to get consistent and confident, which will allow me to scale my plays up to a point where trading profits will cover the bills.

8-20-2010 Futures Techical Update!

Today is options expiration and as we left it yesterday we noted that there tends to be a postive slant in prices, but we did not say why. Markets tend to trade up on equity option expiration due to arbitrage funds covering short equity positions (i.e buying stock) as they close out their option hedges and roll to the next month. This does not however change my bearish stance as one day means nothing. All week I have been sending out updates and price targets to the downside with the wishy washy exception of /HO, which has the potential to be added to the bearish camp today.

Before I go into the futures update I want to talk about market themes and what drives prices. If we take a look back at the rally off of the March 2009 lows we will recall that it was all about the dollar, meaning if you could figure out what the dollar was doing you could figure out what equities and commodoties were going to do. The relationship was inverse to each other, we new if the dollar was down that equities and commodoties were going to trade up and vice a versa.

Then if you recall back a few month ago it was all about the Euro. This one did not last quite as long as the dollar theme but nonetheless it controlled market moves. Currently driving the market are bonds. Everywhere you turn people are talking about bonds. Here is what you need to know about bonds, they have an inverse relationship to equites (bonds go up equities go down). Just to give you an idea of how this relationship has played out equities put in their highs in April of this year and have since been selling off, while bonds but in their low in April and have since traded higher (see chart below).

TLT ETF (Tracks 20 year treasuries)

In my opinion bonds have moved ahead of equities and are indicating a bigger sell off to come. With further downside in equities and the strong correlation they have had with the oil complex this spells lower prices to come. This continued rally in bonds tells me that there is still fear and uncertainty in the market.

Now lets take a look at futures.

/RBOB

In the begining of the we identified the resistance level of 196-1.97 that has held and has been confirmed to resisitance. The trend is down and we have a current downside target around 1.81, based on its current projectory we could see this level as soon as Sep 1st. The smart trade here is short. I would look to get short between 1.94-1.96 using a stop of 1.97. This trade offers a nice risk reward of around 1-3 cts of risk for 11-13 cts of reward.

/HO

HO is currently traded below the 1.99 support level that we identified earlier in the week. As the rest of the market turns I am ready to through this one into the bearish basket with the rest of the junk. I think the higher probability and higher reward trade is on the downside here with 1.90 being the downside target.

/CL

 $76.6 ish is the new resistance level and 72.50 is still the downside target on Crude. We will reavaluate this one once we hit this target or market complexion changes.

What's driving the screen?

Asian and European markets have all sold off after the weak job numbers that were reported in the U.S yesterday. Domestic markets are off about 0.50%. This morning we are seeing some follow through selling from yesterdays sell off, but the day is still young. Futures are down across the board.

It is a light news day and the only catalyst to the upside is that it is options expiration day. But as it looks right now markets are poised to close lower by days end.

Overall risk is to the downside and shorts have a favorable risk/reward vs longs, but you have to pick you entries.

Thursday, August 19, 2010

Its always Bonds, Bonds, Bonds...

Everyone is talking about bonds, what does this mean. Do bonds conintue higher? I continually think back the the presentation that Tom Sosnoff gave in June about contrarian thinking. As you all know I tried the short bond trade back in June but I decided that this trade was early. Since then the TLT which is an ETF that tracks 20 year treasury bonds as rallyed quiet a bit. Today it hit a high of 106.61.

Although I think the bigger money is going to be made on the short side of this trade, I do realize that this trade long has momentum behind it. But anyways I decided to go back and find the original post that I did on this idea back in June --> Prior TLT Post

In the prior post I put a chart together showing the historical for the 20 year rate over the last few years. At its low in 2008 the 20 year rate hit 2.86% today it closed at 3.66%. If you go to the Prior post and scroll down to the comment section you will notice that when I first posted this analysis the 20 year had a 4.05% rate and the ETF was trading somewhere around $97.50. In my analysis I looked at the average move in the move in the etf as a multiple of the move in the rate in absolute terms. What I found was that on average the etf moves 13 times that of the interest rate. On one of my comments on the original post I noted that based on this finding if we were to test the low rates reached in 2008 that this would put the value of the TLT at around $120. Based on the fact that we have about 80 basis points to go, using the same methodology that leaves us with a target to the upside of around 117.25 assuming we see 2.86% again.

A few posts ago I wanted to sell the 100/98 put spreads, essentially getting long but unfortetly this trade slipped through my fingers when TLT had a pretty monstoris move followed by yet another monsterous move. The closer we get to 117 the more I favor the opposite or contrarian play. I think the old saying is "the bigger they are the harder they fall", this trade seems to be getting a bit crowded and parabolic but I still don't think it is ready yet. I am going to be watching this one closely. Only I will probably favor options on the TBT as it is a double inverse of TLT.

Not sure when I will execute and how I will make the trade, but I am interested more and more each day this trades up. I don't think it stops going up until after September expiration as I think a fall in equities in the short term can give just enough juice to the upside.

I will be hawking this one!

Final Earnings Season Stats

Forget the first chart, earnings are easily manipulated and most of the earnings beats were and have been driven by cost cutting measures. The real chart that people should be focusing on is the top line. You can see that we may be starting an alarming trend with 3 consecutive quarters of declines in the number of companies beating on the top line. There is only so much you can cut...Eventually you have to grow sales.


Sent to you by Dominic via Google Reader:


via Think BIG by Bespoke on 8/19/10

Earnings season ended this past Tuesday with Wal-Mart's report, and below we highlight the final tally for companies that beat both earnings and revenue estimates.  As shown below, 65.8% of companies beat earnings estimates, while 63% beat revenue estimates.  The earnings beat rate was higher than last quarter but lower than the three quarters prior to that.  The revenue beat rate was lower than last quarter, which was weaker than the quarter before that.  Earnings numbers started out very strong, but by the end of earnings season, the numbers were just about inline with prior quarters over the last year or so.  As we're seeing today, investors have moved on to economic numbers, and they aren't too pretty right now.

Want actionable advice from Bespoke?  Subscribe to Bespoke Premium today.


Things you can do from here:


Wednesday, August 18, 2010

8-18-2010 Futures Technical Update!

RBOB continues to be week and after an the anticipated rally to work off oversold conditions we are seeing it continue its journey lower trading down almost 2% as I write this. On top of that Crude has broke an important support level at $75 after the API reported a build of almost 6 million bbls in the U.S. In yesterdays update I had said that /HO was not setting up as bearishly as /RBOB and still had a strong support level intact around 1.98-2.00 and that it was likely that we saw 2.06 before we saw the 1.98 again, I was wrong here. However /HO support still remains intact at 1.98 and unless this level breaks we should see high prices.

/HO
I think that support holds at 1.98 and the next target to the upside is 2.02 and then 2.05.


/RBOB
I hold my bearish stance on /RBOB and it continue to make lower lows on it latest down trend started 8-4-10 and believe it will be testing its May low of 1.88 very soon. If we get some real momentum to the downside in equities it could happen this week.


/CL
Last week crude had a sell off of better than 7% and continues to look week. Today after the API report last night crude is off about 2% and broke an important support and in my opinion physiological level of $75. This one is setting up identical to /RBOB and I have a downside target of 72-72.50.


On the economic and news front, today is a very light day. I will re-iterate that I believe yesterdays move up in equities, /CL, and /RBOB was just an oversold rally only to set up for a move lower. As we finish up the tail end of earnings season the market is running out of much catalyst to propel it to the upside and I remain bearish through the rest of the summer and into September.

Tuesday, August 17, 2010

Started a new Short in SPY at 110

Today the markets are getting a nice bounce and I want to be short. The SPY is currently trading at 110.06 as I write this post. I purchased 1 Sep $110 put for $3 and will look to add to my short via 113/114 bear call spreads if we get up there. I think that this market is in the process of putting in yet another lower high, see chart below:


Series of Lower highs:

1) The high for the year is set at 122.12 made in April.
2) Late April we sa a lower high put in at 121.05
3) We then sold off during the first half of May and put yet another lower high after rallying off of the May lows at 117.5
4) After reaching 117.50 in May the selloff making new lows from the prior selloff which followed by another attempt to rally in June to a new lower high of 113.20.
5) The rally in June was followed by yet another selloff to new lows into July, which July saw yet another impressive rally that continued into August only to test the 113 level several times before selling off again.
6) TBD, I think that the market is in the proces of putting in yet another lower high around the 110-111 area on the SPY.

These techicals coupled with the move in bond prices I think are lining up for a nice selloff. We are seeing rates near lows during the worst of the finacial crisis, yet the major indexes are far from the same lows that coisided with current rate levels. Although I do think bond prices are a bit overdone so does the rest of wall street so they will probably continue to higher prices before falling back down to earth.

Are treasuries the next bublle to pop? How much lower can rates go? How long can they stay at these levels? These are all questions that I keep in my mind, because I want to be ready to expoit the TLT for some profits on either side.

Position:

Like I said I bought 1 Sep $110 put at $3 and will look to add to my short position via 2 bear call spreads near 113 if we get there.

Learning to keep my position size very small.

Also keeping my eye on TLT for possible bullish play in short term and bearish play further out in time.

That is all for now!

Monday, August 16, 2010

Lets do the LImbo...How low can you go?


Sent to you by Dominic via Google Reader:


via VIX and More by Bill Luby on 8/16/10

5The speed with which the yield on the 10-Year U.S. Treasury Note dropped from just over 4.00% in early April to just 2.68% as of Friday's close is astonishing – and points to how the bond market is evaluating the prospects for deflation, recession and a prolonged economic malaise, or worse.

This week's chart of the week captures the history of the yield on the benchmark 10-Year U.S. Treasury Note since 1990, when it was hovering in the vicinity of 9%. For additional context I have also included a gray area chart of the S&P 500 index. More often than not, yields on the long bond are positively correlated with equities, but this relationship can decouple, sometimes for an extended period of time.

Those who are interested in the history of the yield curve and may wish to experiment with an interactive tool with yield curve data going back to 1977 may wish to click through to Fidelity's Historical Yield Curve page.

Related posts:


[source: StockCharts.com]

Disclosure(s): none


Things you can do from here:


Sunday, August 15, 2010

Going to Play...But very Small!

I have been out of the markets for what seems like an eternity...I think it has really only been about 3-4 weeks, I do not know for sure. I need to stay focused on the new job, but I also need to make some small plays here and there to continue the learning.

So as we end the most recent earnings season I think that the market lacks any catalyst to make any new highs this summer and that 113 is the top that has held in June, July, and August. The market still has many issues to work through and as we continue to get feedback from different leading and lagging indicators, we are continually reminded that growth is slowing and that the numbers are not indicative of a normal recovery to end a recession. Slowing growth was to be expected after the initial bursts from all the stimulus and bail out money that hit the markets. I am still in the camp that we go lower in the short term before we go higher. These problems can't and have not been fixed in a year. It took many years to get in this mess and we have only put band aids over the problem time and again.

Anyways take a look at the most recent price action from the SPY the past few days after testing that 113 resistance level and after an impressive ralley off the July bottom near 101.50. I think selling is coming back to the forefront and will at least until the next opex in September if not until the next earnings season.


I think the selling will lead to cash flowing from risk assets like equities and into "safer" treasuries. This move may or may not be exaggerated causing a further up move in TLT. Either way I think that TLT will at least remain stable at current price levels as long as we stay under 113 on the SPY. To take advantage of this I want to sell the 100/98 Sep '10 Call spread, currently trading for $0.50.


Like I mentioned in the above post title I am going to keep any trades I do very small (1-3 contracts). To start the position I am only going to sell 1 vertical spread and look to add up to 2 additional spreads. A solid close above 113 on the daily chart would get me out of this trade.

Saturday, August 14, 2010

Must read Book...and a little commentary!

This is my first post in sometime and it will not have any actionable trade ideas. But I think it is worth sharing my thoughts.

Anyone with an open mind or any interest to be intellectually challenged about the future, and the role that America will play in the global arena, needs to read Fareed Zakaria's book "The post-American World". Fareed does a great job painting a picture of how America has achieved great success politically, militarily, and economically over the past few hundred years. He goes further to explain the role that America has played in shaping the world as we know it today. Since America's great rise the world has become more interconnected then anytime in history. Although America has remained THE SUPERPOWER for many decades, a global world is presenting challenges that will need America to remain nimble and open to change. With rising nations like China and India with over 2.5 Billion people America is faced with new challenges and must acknowledge these nations and their desires. Gone are the days that America defines all policy's as to how the world should look and operate. Although we have had a great influence and have played a major role in the rise of the other countries we have to realize they may not have the same goals as we do.

As a superpower the U.S has experienced much prosperity and has wanted to share the American dream with the rest of the world. But at some point you have to draw a line between sharing and force feeding your beliefs on other nations. With powers such as the U.S garners it is very easy to become imperialistic, which when looking back on history has not fared very successful in the long run. The U.S has to acknowledge that the world has changed and that we must change with it, if we want to remain a important player. We need to collaborate and open our borders, not isolate ourselves from these rising nations. During the countries great rise it was because of this openness to race, religion, immigration, free trade, etc., that has led to the vast prosperity that this country has experienced.

If we wish to continue to be respected as a world power gone are the days of "do as I say, not as I do", if we wish to set policy that the world should operate under, then we too need to follow them. But they need to be formed with representation from the rest of the world as well. And yes there will be compromise, the American way is not always the right way, as shocking as the may sound.

Don't get me wrong, I love America and believe in our ideals. But I think that everyone can take a step back and realize that just like people countries make mistakes too. I think that America is more then capable of making the necessary changes to remain a super power in the global arena among the "rising rest" that Fareed Zakaria talks about in his book.

We have many issues on our plate now that will take time to work through, and we may have to feel a little pain as a nation to get through them, but we will come out stronger because of it.

I am bullish the United States in the long term and I sincerely believe that we will make the right decisions as a nation that will propel prosperity in this country and the rest of the world for generations to come. Just realize that it is not going to happen overnight.

With that said go read "The Post-American World" by Fareed Zakaria.