Sunday, October 31, 2010
Cool Tools from Trademonster.com
As you all I know, I occasionally check out other platforms as they make improvements and added features. A few months back I checked out a platform Livevol, which was a really cool and useful tool as you get further into your options trading career. It retails for about $100 a month. Well now trademonster is adding those same scans for free to its platform. They do not have them all but they continue to make the library larger. So if you get a chance check out the trademonster platform.
Friday, October 29, 2010
How are you playing QE2?
Let me tell you I am so tired of talking about QE2 and am glad that it will finally be out and in the open once the fed conludes their two day meeting next week. We have seen estimates of 500 billion to 2 Trillion. Then you have GS saying that anything under $4 Trillion will be ineffective.
But since then the number has been tempered a bit to a few hundred billion dollars over several months. I think that the markets have been pricing in a much bigger package and we might get a sizable corrective move after the details are released. But you also have to look at the flip side, the market may take it as the economy is not doing as bad as everyone thought, therefore the fed does not need to print that much more money.
But I will tell you, aside from teh trades that I have on that are non directional plays, I am playing this with a bias to the short side. I have the following positions to the shortside going into next week.
1) Long 5 RBOB Dec '10 2.04/1.90 Put spreads @ $0.0525
2) Short 5 CL Dec '10 80/82.50 call spreads @ $0.85
3) Long 5 CL Jan '11 83/78 put spreads @ $1.84
This is where I stand going into next week.
How are you playing next week?
Thursday, October 28, 2010
New Crude calender spread
Today I put on a front to back calander spread using the Dec and Jan Crude Futures. I am short the Dec contracts and long the Jan contracts. I put this trade on locking in a diff of 76cts over the Dec contract. So you would say I am long the Jan/Dec at +76.
I like this trade for a few reasons. One is the liquity of these contracts is great, 2nd its easier than playing flat our direction, and lastly because of an abundance of inventory. We have more crude then know what to do with and I do not see that happening anytime soon. The spread has gotten as wide as +140 or $1.40, seen in the begining of September. There is price support around +65 ish. I am looking to add around this area if it comes in some more and look for it to expand back up towards +140. I would stop the position out below +60 and would probably sell half if not all around +100 to +110. So risk is about 10cts (assuming I get the second set of 5 lots, Avg price would be +70 with stop at +60) for a reward of 30-40cts.

I have 5 lots of Long Jan '11 CL and 5 lots of short Dec '10 CL at +76.
Monday, October 25, 2010
Goals going foward...
I have not had a lot of time to post over the last few months due to the new trading position. But my goal has always been to make it back to the blog on a regular basis. But starting in November my goal is going to be to post and update about every position.
Keep me Honest!!!
Keep me Honest!!!
What my positions look like going into products OPEX
When I talk about OPEX, I am talking about option expiration for the RBOB and HO products option expiration cycle. It is a bit different then equities which happens the 3rd Saturday of every month (last day to trade is the Friday before). For RBOB and HO opex falls two days prior to the expiration of the futures contract, as is the case for Crude Oil. But note however that Crude has diferrent expirations than that of RBOB and HO.
So with that said lets take a look at what I am holding onto going into OPEX tomorrow. Below you will see all my current holdings that are exposed to the NOV opex cylce. I have ran through 2 of the most likely scenario's for tomorrow and what that means in terms of P&L for me.

So with that said lets take a look at what I am holding onto going into OPEX tomorrow. Below you will see all my current holdings that are exposed to the NOV opex cylce. I have ran through 2 of the most likely scenario's for tomorrow and what that means in terms of P&L for me.

So for NOV my P&L will fall somewhere between + $6,510 to - $14,490, or about a $20k range. My money spot is right at 2.22.
Tuesday, October 19, 2010
Be very very Careful.
Keep a watch out on the $SPX and get prepared now for the storm before it arrives!
Once again I will say if you do not have protection against a market sell off, get it now. Take a look at this chart.
Now take a look at this chart. Look at the month of April up above and then down below.
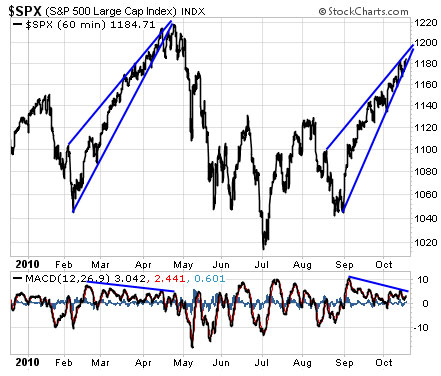
If this doesn't scare you I'm not sure that Halloween's gobblins are going to phase you. These charts come from Jeff Clark at the growthstockwire.com. Before you write this off as just another crazy guy with his charts know that this bearish wedge formation breaks to the downside at around 80% of the time. Jeff Clark is the best in the business at short term trading so you'd better heed his warnings. I suggest December puts against the SPY or for the more courageous calls on the SPXU(3x the DAILY move in the S&P 500, more of a short term trading vehicle, not an investment)
Do Your Own Diligence....it's your money...Act like it!
Monday, October 18, 2010
It's still about the Mighty Dollar and and an Update on our Positions.
It's still all about the Mighty Dollar!!
Look at the chart below specifically at the red circles and you will see that the dollar is WAY oversold and becoming less so as we speak. While the old saying goes that the market can stay irrational longer than we can stay solvent we use option to try and even the odds against this fact. I mentioned this back on Sept 29th 2010 and gave you a trade to play this upturn in the dollar and even a way to benefit while we wait for the upturn to happen. See link for more information on the trade. http://inthemoneytrades.blogspot.com/2010/09/watch-out-for-dollar-before-deciding.html

In case you've been living under a rock over the past few years and specifically the last few months and haven't noticed, the dollar has been under enormous pressure as the Federal Reserve (Ben Bernanke) has all but stated that they are going to print money in order to get the economy roaring again ala via QE2 (Quantitative Easing Part 2).
While I personally believe throwing good money after bad is useless and will not solve any of our financial debt issues, the stock market, the materials sector and anyone that thinks they know anything about investing in stocks has decided to party like it's 1999 by throwing caution to the wind by buying anything and everything in sight in order to get out of dollar denominated assets. This prescription for disaster has been good to the dollar bears short term but I have noticed the boat getting a little heavy on one side. When this happens no mater what we're trading the counter trend is close behind.
The way the market has been rallying lately with common sense being thrown to the wind the visual I can paint for you is imagine sitting on a beach watching a Tsunami rolling in, the wave might be beautiful but once it hits all hell breaks lose and what was once beautiful has now just become your worse nightmare. This is what we are experiencing currently with regards to QE2.
The Trade:
We got long by purchasing 50 UUP December 23 call contracts for .40. As I showed you in the past chart the dollar had not turned up.....yet but it should over the next few weeks to a month. Based on this thought to help finance the purchase and lower my cost in the trade I sold 50 of the October 23 calls for .17 cents. I have effectively said the dollar will drift here and I'll take the time premium and pocket that cash waiting on the dollar to turn up. This worked out perfectly as the Oct 23 call expired last Friday letting us pocket the entire $850 we collected on the calls we sold. We are now long the December 23 calls for a basis price of $1150.
How did we come up with this number you ask?
We get this by purchasing 50 calls x (100 shares equals 1 contract) = 5000 shares x .40 = $2000
We sold 50 calls x (100 shares equals 1 contract) = 5000 shares x .17 = $850
$2000 - $850 = $1150 is our basis in the option.
What we do now:
Based on my original thesis that I've laid out above as well as they way things are looking in the broader market as well as the chart above, I believe we will see a violent snap back in the dollar which could force everyone to cover over the next few weeks. When this happens the stock market, commodities, oil, gold, etc will go down. This whole melt up has been based on the dollar weakness. This could reverse very quickly and in fact might happen this week as GOOG, AAPL & IBM have all reported earnings. While their earnings were great bottom and top line numbers, investors had poured into these stocks pushing them up to all time highs which when you hit every pitch out of the ball park you're doomed to hit a double which is not good enough in this market and the markets are punishing these stocks in the after hours. Tomorrow is a new day and we'll see how things open but considering AAPL makes up 20% of the QQQQ's that could push this index down which could shift sentiment quickly over to the booking profits side. Keep this trade open and we'll monitor it.
Other trades Open:
Back on Sept 30th we put on the following trade of Nov 115 Puts as protection for $4.10 per contract. If you had no protection against any market rollover this was a good trade for protection.This trade is down to $1.38 per contract currently but with the sell off after hours in the tech stocks this trade which is our insurance against any forthcoming sell off might come in handy. Hold for Now. Click on the link to read more about the trade.
Back on October 6th, we put the following trade on for the stock FFIV. We bought the Jan 2013 $85 call and sold the $105 call for what is called a bullish call spread. This should have cost you around $850 - $900 dollars per contract and can still be purchased in this range amount. We still like this trade. The stock is now trading for $91.00 per share.
Thats going to do it for today. Remember to keep a watch on that dollar with the UUP etf. If it breaks out watch out below in the overall market and commodities(oil & gold) in particular.
Happy Trading *DYOD* (Do Your Own Diligence)
Marty Blackmon
Marty Blackmon
Friday, October 15, 2010
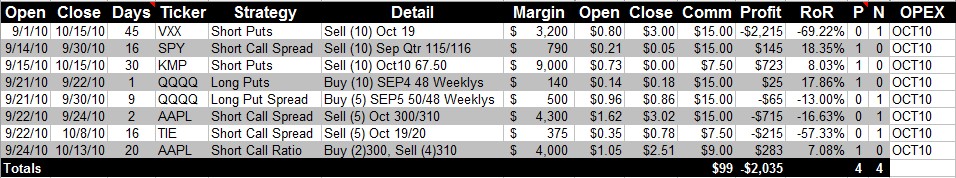
OCT 2010 OPEX
This was one of my worst months. I've got worse but still haven't made the time to recreate my trade history going back to mid 2008. I lost big on two trades and they had something in common. The first is the VXX trade which was a lack of diligence on my part. I didn't learn of the tracking disparity of this instrument until after I had long exposure via short puts. My original thought process back on 9/1/10 was that VIX wouldn't break 20 through SEP/OCT and I was willing to get long exposure if it did. At the time the VXX/VIX disparity was only about 2, so I sold 19 puts on VXX for .80 that put my cost average at 18.20. I figured this was a good enough proxy for VIX 20. So it turns out I was wrong anyway as VIX went as low as 18 and closed today at 19.40, but I lost much more than had VXX been a better proxy. The point is I entered in to a position without having full information, and that's not investing, that's gambling.
The second losing position that I'm not happy about, and not just because of the dollar amount loss, is the short AAPL call spread. In my initial post I said I thought this stock had a date with 300, but that I thought it would stall there. Why would you sell a short 300 call if you think the stock is headed that direction? This was another case of old habits of just putting on a trade without putting it through my trade worksheet to see if it makes sense. I've gotten back in the habit of putting on trades and THEN running them through my filter. So I did this, and what I found was that I would actually prefer to be long the 300/310 call spread for two reasons. One is that IV has a history of increasing slowly towards earnings and this OPEX closes out a day before AAPL has earnings, the second was the chart pattern that I believed was taking AAPL to 300. So I got up the next day to close out my short call spread and put on a long ratio spread. I ended up having to pay through the nose because the underlying opened up $4 that morning. I'd like to say this is a learning mistake and it won't happen again, but its already happened in the past, which means I'm not learning from my mistakes. This is simply a matter of discipline and laziness. So I humbly take my two losses this month and hope the pain will remain with me long enough to not make these two mistakes again. Between these mistakes and the unwarranted risk I took on last month with short calls, I've really gotten off track and need to regroup.

The second losing position that I'm not happy about, and not just because of the dollar amount loss, is the short AAPL call spread. In my initial post I said I thought this stock had a date with 300, but that I thought it would stall there. Why would you sell a short 300 call if you think the stock is headed that direction? This was another case of old habits of just putting on a trade without putting it through my trade worksheet to see if it makes sense. I've gotten back in the habit of putting on trades and THEN running them through my filter. So I did this, and what I found was that I would actually prefer to be long the 300/310 call spread for two reasons. One is that IV has a history of increasing slowly towards earnings and this OPEX closes out a day before AAPL has earnings, the second was the chart pattern that I believed was taking AAPL to 300. So I got up the next day to close out my short call spread and put on a long ratio spread. I ended up having to pay through the nose because the underlying opened up $4 that morning. I'd like to say this is a learning mistake and it won't happen again, but its already happened in the past, which means I'm not learning from my mistakes. This is simply a matter of discipline and laziness. So I humbly take my two losses this month and hope the pain will remain with me long enough to not make these two mistakes again. Between these mistakes and the unwarranted risk I took on last month with short calls, I've really gotten off track and need to regroup.
Current and New Positions
So I apolagize ahead of time for not being able to post in a timely matter about my positions, by my work is my priority and I post as I have time.
First lets list my current positions:
1) Short 5 CL DEC 80/82.50 call spreads (left over from iron condor)
2) Long 5 HO NOV 2.06/1.99 put spreads (mostly worthless)
3) Short 5 HO NOV 2.12 calls left over from covered call
4) Short 5 HO NOV 2.27 puts to cover futures for short call above
5) Long 2.27 HO covered call
6) Short 1 RB 2.16 straddle
7) Long 10 Mar/Mar RB/HO spreads
8) Long 5 Nov/Nov HO/RB spreads
So lets talk about the positions now. I am still short the 80/82.5 call spreads left over from the iron condor that I sold as I bought pack the put spreads at 10% of the original sale price. The long HO put spread is basically worthless and I do not want to waste commission buying it back, unless I can get enough to cover commission and then some. I originally had a 2.12 covered call, but I had sold the covered HO futures on accident on another trade and never really had an opportunity to get thos futures back at what I considered a reasonable price so instead I decided to trade around those short calls and then sold the 2.27 puts just incase to cover that position or at least move my break even up.
At the same time I sold the 2.27 puts I also put on another 5 covered calls at the 2.27 strike. Two days ago I decided to sell one ATM straddle on RBOB with the possible intention of taking delivery on the short put.
I am still long the Mar/Mar RB/HO spread which is really one of my core positions. Today I added the Nov/Nov HO/RB spread as it has come in from 23 over to 12.90 over where I got in today. Dec is trading about 17 over so I will be looking for a move to around here as we move Dec becomes the prompt month.
That is all I have for now...Wish I could give more but have to head to a meeting.
Thursday, October 14, 2010
Follow up post!
Back on September 24th I wrote a post about two current positions I had on. I just wanted to give a visual as to why I thought the Mar/Mar season RB/HO spread is an attractive trade to me.
If you recall I am long the March RBOB furtures and short the March HO futures. I am only playing the spread between the two and am not concerned with price movement in either direction. I am currently long 10 such spreads with an average spread at 18.80 cts under (meaning that RBOB is trading at 18.80 cts lower then the HO contract).
Lets take a look at the historical performance of this spread:

As you can see from the above chart I have plotted the perfomance of the Mar/Mar RB/HO spread for the past few years, with the dark blue line representing the average of all of the historical data from the past few years. With the execption of the 2008-2009 move this spread has worked out pretty well by moving from 20 cts under to about 2 under on average (September entry and Feb exit). I think that due to the huge sell off in the oil complex during the financial crisis that 2008-2009 can be thrown out the window as an anomoly.
Why does this trade work?
As we move out of winter and start begin to work our way to the peak driving season HO demand should come off and RB should be the dominate product in demand. This move will cause the differential between the two products to narrow, thus resulting in a profit. This same seasonal trade in reverse can be played as we get into the peak driving season where by you sell RBOB futures and buy HO futures, but I will save that for another post.
I have a stop in on the spread at around 23 under and I am looking for a move of around 15-20 cts towards and above the zero line. I am long the RB/HO spread with an average price of 18.80 under, as I write this post the spread is trading for about 16.28 under. This puts me about 2.5 cts in the money or about $11,000.
Size = 10 lots
Risk = 4.2 cts, $17,640
Reward = 10-20 cts, $42,000 - $82,000
I am tentively going to hold this thing until Febuary, unless I am able to 10cts or better before then.
Wednesday, October 13, 2010
AAPL Ratio Spread
fAfter closing out my short 300/310 call spread for a loss and analyzing the trade more, I just felt this stock had a destiny with $300 and IV was historically low so felt like being long made more sense but didn't want to take the risk of being wrong. I didn't want to pay the $6 premium for those calls, so I bought (2)300 calls and sold (4)310 for a net of $1.05. My hope was that it stayed in its uptrend channel and I could get out for a profit before expiration. But I didn't lose anything on the trade until the $320 strike so really wasn't concerned. But of course as soon as I put the trade on the stock tanks almost $20. It was meant to be a lotto ticket type play with a net debit of $210 and average possible payout of $1000 between the 305-315 strikes. So I just hung on and was able to get out for a small profit today of $300. I closed at about $301.50 intra-day. I felt that with only 2.5 days to go the likelihood of pinning near $300 was great and that would be a loss for me so I took what I could get.
Below was the risk analysis just after I closed the trade earlier today. I had to recreate the trade and prices since it was already closed out. The trade has a lot of potential profit it it goes higher the next two days, but could be and was a complete loser as of yesterday, so just felt prudent to take something rather than nothing.


Below was the risk analysis just after I closed the trade earlier today. I had to recreate the trade and prices since it was already closed out. The trade has a lot of potential profit it it goes higher the next two days, but could be and was a complete loser as of yesterday, so just felt prudent to take something rather than nothing.


Wednesday, October 6, 2010
It's all about Friday's Job Numbers & the Dollar....Still!!!!
What happened today:
Today's market really provided no clue whatsoever as to which way we're going....up or down.
What everyone is waiting on is the employment report on Friday. This could be a big mover in the market as the market has priced in or is in the process of pricing in more QE2 (Quantified Easing 2), which simply means we're going to print more money and try to create inflation.
I personally am bullish on gold and silver for the long time and have been if you've known me for that past 9 years. With that being said you need to be careful if you own gold/silver via ETF's in the market currently and if you do not own any protection.....you are playing with fire. Get some protection either by selling calls or buying puts. If the dollar trades higher which I have blogged about recently and have a trade that is doing exactly what I thought would happen over the past week, you better watch out, gold, silver, and oil will sink which will also sink the stock market. I'm not saying this is going to happen but the odds are clearly tipping to this happening soon so get some protection against the market and your precious metals and keep watching the ETF UUP for which way we go.
What we saw today?
What we did see is just how fast things can and will fall if things don't go exactly as planned. See the sky high flying Cloud computing stocks today for what I mean (VMW, CRM, FFIV) These all got thrown out with the bath water as the baby Equinix blue up it's earnings today. This company lost 35 points today as it opened at 105 and closed at 70.19....now that's what I call the cloud popping.
If you've been eyeballing a few of these companies I'd wait for a day or so and let the people that didn't sell today watch the news tonight, sell tomorrow and then put a buy in.
The Trade:
My suggestion is to pick up FFIV anywhere near $90-$95 a share if you are a stock buyer. Of course I prefer options so I'd purchase the Jan 2013 $85 call and sell the $105 call for what is called a bullish call spread. This should cost you around $900 dollars per contract.
This gets you in with the option to buy this stock in Jan 2013 with a basis of $117 which is fair value for the stock as of today.
One of several things can and will happen over the next 3 years of owning this:
1) You sell for a tidy profit anytime between now and Jan 2013.
2) You hold and this company grows and you sell years from now or
3) The company gets taken out when the inevitable consolidation happens between the clouds.
Happy Trading *DYOD* (Do Your Own Diligence)
Marty Blackmon
Friday, October 1, 2010
Energy really popping to the upside...feeling toppy!!!
The oil complex has been on a tear the past three days with some pretty explosive moves to the upside. Although I had anticipated and had played this move to the upside, it has gone much farther then I imagined it would. Most of the move started after the DOE came out with its weekly reports and showed draws accross the board. The other thing aiding this upmove is the start of the new quater and new money flowing in.
The fact that most people have forgotten is regardless of the small draws seen last week, this market is still way over supplied with inventory builds at multi decade highs. There are still a lot of issues out there that need to be resolved. Housing continues to suck...GDP continues to slow on a sequential basis...and where are the jobs? We can't have any sustained recovery on without jobs.
I know that the fed has hinted towards QE2...but with a balance sheet already carrying well of 2 trillion, what is the talked about 500 billion really going to do? And even if it is effective, is it sustainable.
Anyways enough about my rant...I have gone short all three products in the oil complex via call spreads.
RBOB

Really RBOB should be the weakest of them all as we have exited the peak driving season. And this is evidenced in the 20cts under HO. RBOB is coming up against its 200 day moving average, which is spot that I think it will fail at, and we probably get a trade back towards 2 bucks.
I sold 5 of the 2.08/2.15 Nov Call spreads.

I sold 5 Nov 80/83 call spreads and I also sold 5 Dec 68/70/80/82.50 unbalanced Iron Condors.

Lastly I sold 5 Nov 2.25/2.30 call spreads.
To to point out to everyone when trading energy options they expire the month prior to the month your are trading. So the Novy options will expire in October and the Dec options will expire in Nov.
Subscribe to:
Posts (Atom)