Friday, April 30, 2010

I feel so affluent

OPTIONS INVESTORS ARE MORE EDUCATED, AFFLUENT AND STRATEGIC
THAN THOSE NOT USING OPTIONS, NEW OIC-SPONSORED STUDY FINDS


CHICAGO (April 29, 2010)
- The Options Industry Council (OIC) today released the results of the latest study conducted by Harris Interactive Inc. and found that not only are investors who use options more educated and affluent than investors who don’t use options, they also tend to be more strategic investors who are more open to new ideas.


The Options Industry Council (OIC) sponsored this study, as well as studies in 1995, 2000 and 2005, to assess interest level, knowledge and usage of options by investors to better direct its options education efforts. The studies are also important for financial advisors, showing them how options investors make attractive clients and prospects.

Each study consistently found that options users consider themselves more knowledgeable investors than investors who do not use options. Furthermore, the studies have shown options users are more likely to have a wider diversity of investments in their portfolios beyond listed stocks compared to non-options users. Finally, the demographic trends throughout the surveys recurrently show people who invest in options are more likely to be college graduates, have higher incomes and a higher value of liquid assets than those who do not use options.

To access all of the Harris Study summaries, visit http://www.optionseducation.org/press/research.jsp.

Monthly Options Education Goals

In addition to posting trading results each month at OPEX, I'm also going to start listing my options education goals for the month but I'll do this with calendar months on the 1st each month. I'll also update my progress for the previous month. So on Saturday I'll post my first goal list for May. I made a preliminary list and its pretty daunting. I've got so many known areas of things I need to learn and undoubtedly new ones will present themselves. In the past I've struggled with trying to do too many things at once at the expense of all of them getting done inefficiently. So I then tried to step back and concentrate on just one thing (life CFA study) and hope to knock things off the list more efficiently, that didn't work either. So hopefully I can find that right mix. I don't have any time restraints so there isn't an excuse. I will continue to make the same type of small trades that I'm comfortable with and see how the learning curve goes on new material and how I incorporate that in to future trades.

My short-term goals are to just continue doing what I'm doing and learn, long-term I would like to find an ideal portfolio strategy that incorporates my style/level of risk appetite, capital levels, and income goals. I would ideally like to find a job so I can let trading profits grow with the eventual goal to have enough capital and trading results to prove to myself that I can comfortably manage my own capital for a living. I have no idea when that might be so it's foolish to put a time frame goal on that. I'll just keep working towards it and I'll know when I'm there.

Frustrating morning/personal update

I pretty much took the day off on Wednesday because I was running errands. I checked in after the close and had another one of those lucky days where the naked puts I sold moved in my direction by 50%, so I got up this morning and was looking to close those out but it was too late. It wasn't a huge deal, it was $180. I had sold naked $17 puts on (BAC) for .38 and they were .19 at the close yesterday. I had done the exact same pay early last week, literally sold for .38 and bought back for .19 and was looking to get back in it again. Well I got that chance but missed getting out a second time. This made me notice something though, I'm currently only putting on positions sizes that don't scare me, nor get me real excited. They aren't big enough to make me want to check in every 20 minutes and they're small enough that if the worse case scenario happens I'm OK with it. I don't know what the right position size is for me right now, I think until I get a grasp on an overall portfolio strategy with position size limits that there is no right position size for me yet.

So here is my personal update. I took a few days off from CFA studying because I was burned out and found myself just sitting there and not really learning much. The pace got so slow that it made sense to step back for a while. I was hoping it would rejuvenate me as that's worked in the past. But the truth is I've been fighting this since day one. I've never hit my weekly target for hours and that just meant I had to speed up the pace as we get closer if I'm to have any chance. I thought it made sense to try and knock this out from Jan-June but Level I took me the better part of 14 months to properly prepare, I don't know that 5 months for Level II was ever a reality. I would rather prepare on my own time frame and then take the test when I'm ready. If that means I have to wait 10 months after I'm ready then it's disappointing but so be it. I found myself not happy in general and just got tired of it. I also had to admit to myself that part of studying full time and then waiting for the results to come out in August was really just an attempt at justifying not looking for a job.

So as of today here is my current plan. I'm starting the options mentoring next week and that last nine weeks. I'm looking forward to finally being able to put in some serious hours on something that makes me happy and brings in money. I also believe it's something I will be a part of for a very long time in the future, so this just makes sense to me. I still very much want to complete the CFA program so I will still study each day, just not 4-5 hours per day. The mentoring last until the end of June and I might be done with CFA by then as well. So the rough plan is to just study both a few hours each day, in addition I will be doing job research. I'll just kind of diligently put in hours each day towards those three things and play it by ear. I also already starting making sure I exercise an hour a day, I started that a week ago. Between taking some time off, exercising, and putting in some time on something I'm passionate about, the quality of my life really got dramatically better these last few days. I'm truly happy right now. I know we've talked in the past about finding that right balance, as of today I've got a better grip on that than the last few months.

Watchlist

I have spent most of the week just watching the market and going through my long watch list of stocks. Throughout the week have been able to take my long watch list with about 50 names and narrow it down to about 16 names which I am interested in. I will be looking at these select few of stocks this weekend in more detail and put some trade ideas together. Below is a copy of my 2nd pass watch list:


I will post any ideas that I come up this weekend.

Tuesday, April 27, 2010

Iron Condor in SPY

So I am getting past my mental block when it comes to size. I am going to play with the iron condor a little more but with very small size when it comes to risk and contracts. Which will in turn lead to a low reward. But I want to get more experience with this type of trade and the only way I am going to do that is by trading it. So I am going to use the SPY for such a trade. I am going to sell the 123/124/115/114 Iron Condor for a $0.35 credit, leaving my risk at $0.65.


In the chart above I have highlighted in grey the area of profitablility for this trade. It is bascially profitable betwee 114.7-123.37. I think we have hit an intermediate top at 122.12 which kind of pisses me off as I got stopped out by $0.30 from my puts that I bought the other day which would now be in a profit of about $450. But that is niether here nor there, my timing was wrong. I also think that the January highs will be a very important level if we go down that far at around 115.

Here is the Risk Profile from TOS:


So lets see how this plays out. I think this is a good trade but also a mental accomplishment.

New Energy Investment in XLE


I have been wanting to get involved with the XLE ETF for sometime now. But felt that my trading account would not give me enough time for the position to work out. So today I did a buy write at the $62 strike with May '10 expiration for $60.54 with the ETF currently trading at 61.66. Not sure why I did not just sell the $62 put, for some reason I wanted to actually own something. I think it is very likely that I get called out by May expiration which I am fine with and would look to initiate a new position in the same name. But if I do get called out by May it would be about a % gain for 24 days.

If you look at the weekly chart I posted above 61 seems to be an important level on the weekly as it was resistance for several months.

With this trade I am maxed out of my available $10k in the investment account either until I add more funds or if by May expiration I am called out of this position or the puts I have sold on NLY and ANH expire worthless. We will see in 24 days.

Monday, April 26, 2010

2 Seperate Accounts

Ok. So I now have two seperate accounts in IB. One is for my investments and one is for my trades. I will continue to track it all on the same sheet. But I will add something that distingueshes them, not exactly how I will present it yet but I will keep you all posted.

With that said a while back I had sold some puts in ANH and NLY in an attempt to get long the stock. In my investment account I have sold 5 May '10 7.50 puts @ $0.60 putting my basis at 6.90 with the stock currently trading at 7.12 and earnings coming up this week. I also sold 2 May '10 17 puts @ 0.28 on NLY putting my basis at 16.72 with the current stock price at 17. They also report this week.

Let me also note that my trading account has $6k of capital and the investment account has $10k. In the investment side I will mostly just sell puts and write covered calls and look to collect dividends.

Sunday, April 25, 2010

The TESTED Method


Sent to you by Dominic via Google Reader:


via Psychtrader by Darren on 2/4/10

Some have said that trading is 90% mental and 10% technical and that successful traders learn to remove emotions (or at least control them) from their trading decisions. The TESTED method is a process to help remove emotions from your trading and allow yourself to be proactive in your trading. An example follows that shows how important it is to use the TESTED method and the process used in the proper order. The first step, and probably most important, is the Target and that is where we will begin.

Target

A key decision that needs to be made is where you think a certain stock is headed, or at least where it's capable of heading. We'll use a metaphor for trading that involves a trip. Let's say we wanted to hold a conference in Las Vegas, and so a plan was mapped out and a date was agreed upon. Some of us would fly others would drive, and some might actually walk. The point is that we all know where to go (target), and there are several ways to get there. In the end, we all meet at the same point.

Trading is the same way in that we might think AAPL is going to $200 a share and so we can choose to buy stock, options, or even single stock futures. Simply put, we all agree upon the price (target) and that will determine the instrument we choose to trade AAPL.
AAPL

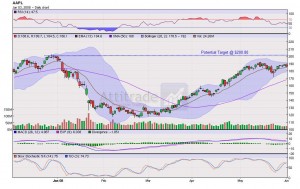
Looking at AAPL, we can see that the stock is at $186 a share and we can compare the target using both stock and options. Our initial investment with the purchase of the $185 calls would be $1,200 and we would have 45 days for AAPL to get to our target of $200. If we purchased the same amount of stock, our initial investments would be $18,600 and we wouldn't be limited by time as we are with options. Two decisions need to be made at this point and that will divide traders into two camps. One decision would be how much you are willing to risk in the trade with your initial investment. Obviously the option is roughly $1K and the stock is $19K. The second decision is whether or not we want to have time as a factor in our trade. Regardless of our decision, we are still figuring on AAPL making it to $200 a share.

chain

To take this example even further, we could make a few assumptions. Let's say that AAPL did make it to $200 but it took 30 days to do it. If we bought the $185 option and APPL is now at $200, we have $15 intrinsic value in our option. However, our option cost us $1,200 so we are actually up $300 (minus the 15 days of time value, so we could roughly estimate that we would be up $315). If we bought the stock at $186 a share and it is now at $200 we made $1,400. Notice the big difference in the two choices with the same target in mind. Take the return on investment (ROI) and you can see that with the stock we had a 7% return and with the option we had a 26% return. Obviously there is more to this equation, and one is the time it will take to get to the target.

The time frame gets you to answer the question of how long it will take for your trade to progress to the point of exit (Target). That exit can come in the form of a triggered stop or, preferably, a triggered limit order. Take into consideration the ATR, Beta, and the average gain over a 6 month period of the stock you are trading to help you determine the time it will take to reach your target. Once you have an idea of the number of days it will take to make it to your target, you should double it in case you are wrong and the stock trends sideways or moves against you for a day or two (if you are trading with the purchase of an option, triple the amount of time).

If you look at the chart of AAPL, we can see that for the 6 month period, it is basically where it was in December. This method of using a 6 month average wouldn't work so we would need to find a trend of at least two months where we can get an average monthly gain. If you look at AAPL back in mid March, the stock was at $120 a share and today it is up around $185 which translates into a $65 move. Divide that by the number of months and you can see that AAPL has the potential to move in great strides in a short period of time. You can also see that AAPL has no problem moving down either and the moves down actually outpace the moves up.

Another way to find a timeframe is to use the ATR and cut that in half. AAPL's ATR is $5.47 for the last month so take $2.75 and you can expect roughly that much of a move every two days or so. This is the roughest of estimates and the method is rather subjective, so always err on the side of caution and reduce the expected moves. The whole point of this exercise is to get you to look at the left-hand side of the chart and really understand what the potentiality of the stock is. Using the information from our example, we can see that AAPL should have no problem reaching our $200 price target within a week's time so we will focus on the July calls or buy the stock outright.
This time frame would fall under the category of a "swing trade" and as such we can expect to be in the trade anywhere form 2-8 days. The other categories would be a "day trade" a "momentum trade" and an "investment" with the timeframes being 2-8 hours, 2-8 weeks, and 2-8 months respectively. Hopefully you have an idea of what kind of time frame matches your lifestyle and as such can choose the appropriate target and timeframe. Now that we have the time frame and target in mind, we need to decide where to get in this trade.

Entry

Deciding where to get in a trade can mean the difference between success and failure. Oftentimes, the typical "get me in with a break above the prior day's high/low" is what most traders use as an entry point. This method does not work as many times a prior day's low/high is breached by traders to trigger orders like that, and then they take it in the opposite direction. The key is to not become a trader who is filled and then stopped out within hours. The TESTED method uses the Average True Range (ATR) of the stock to help us in figuring out a nice entry.

The ATR (20) of AAPL is $5.47, so if we wanted to decide on an entry, we would need that number to help us be more exact in our order entry. We use a 20 period ATR because that represents a month in the market and gives us a nice snapshot of the potential movement of our stock. Regardless of whether we are trading straight stock or options, we need that ATR.

Let's say that we want to use 10% of the ATR to get an entry defined, and that would be roughly $0.55. Take that $0.55 and add it to the prior day's high and that would give you a more accurate entry. In the case of AAPL, the close of the prior day's candle was $186.10 and if you add the $0.55, your entry would be $186.65.
Microsoft (MSFT) has an ATR of $0.67, so if we took 10% of that, we would have $0.07 that we would add to the prior day's high. It is simple to see that using a percentage of the ATR allows you to compare APPL to APPL and not APPL to MSFT as the case would be if using the traditional "$0.03 above the prior day's high" tactic for entry. We can, and should, use the percentage of the ATR for stops as well.

Stop

A stop is the ultimate "double edged sword" and is probably one of the most misunderstood and wrongly used tools in trading. You can use a stop to get you in a trade and to get you out of a trade. Think of a stop as the horn in our car. We "beep" it when we want to get someone's attention. In this case, that someone is our broker and we need to either get in a trade or out of one. Using our trade example of AAPL, we can look at possible stops for this trade and how we would set those stops up. With options, you oftentimes hear something like "set your stop at a 30% loss in value". In our example, we would have purchased our option for $12.00 and 30% of that is $3.60 so our stop would be $8.40. This may work fine for the casual trader. However, as a proactive trader, we actually want to use the movement of the stock to get us in and out of a trade. Think about that. Options have volatility and that alone can cause price fluctuation that can dissipate instantly as the trading day progresses. The daily swings in volatility alone could trigger our stop and get us out of a good trade.
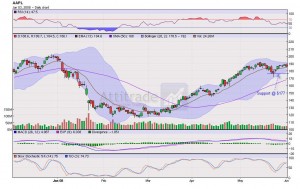
AAPL Support

A proper stop on options should be tied back to the actual stock's price movement. If you look at AAPL again, you can see that the stock has shown some support at the $177 level and that is what we would use as our initial stop. Its "initial" in that we are going back to our ATR and taking that 10% ($0.55) and subtracting it from the $177 to get our stop of $176.45. Once again, we use AAPL's potential to get us out of the trade and not just some arbitrary number like "$0.03 below the low". Interestingly enough, the stop for our option trade using this method would equal a 55% loss on our initial investment of $12. As stated before, if you are not comfortable with that potential loss, then you should be looking for a different stock to trade or a different instrument. In doing so, you allow yourself to remain emotionally detached from the trade and you can proactively prepare yourself before you even submit the order.

Thoughts

To truly become a proactive trader, you need to believe that your trade WILL go the direction you thought. This shows that you have belief in your system that finds your trade setups in the first place. If you put your trade on and the first thing you do is mark your stop or think "I hope this goes well", then you are bound to fail as a trader. Successful traders do not hope. They do the research and use their system to find good candidates and enter the trades. It is at that point that they manage risk. They know exactly how much they have at risk and are perfectly fine if they lose that much. Why? Because it is baked into their system, and every trade does not go the way they thought. You need to be the same way in your trading.

You need to have the courage to fail, step off the curb, and enter the trade. Expect that the trade will go your way and use the power of positive thinking. Set your target, entry and your stop and then you know, at any point during the life of the trade, where you stand. If your target gets hit and you see the stock continue to go the same direction, you can't get mad. You simply put the positive trade aside and evaluate it in a couple weeks to figure out why it continued to go beyond your target. It is at that point that perhaps you make an adjustment to your system. Perhaps you find out that it was a news item that caused the surge and then you know that it was atypical, rather than the norm, and no adjustment is needed.

In going through this thought process, you prepare yourself emotionally and as a result remove the chance of trading on emotion once in the trade. As an example, you need to be fully prepared to lose the amount invested in a single trade if your stop is triggered. If you aren't fully prepared to take that risk, then you need to adjust the size of your trade or move on to another trade. If you prepare and emotionally accept the fact that you could be wrong, your trading becomes more mechanical and less emotional. Take some time to role-play the different scenarios and see what your reactions would be.

Evaluation

Oftentimes traders beat themselves up because they left money on the table or set a stop too tight and vow to never do it again. That vow usually leads to trading on emotions and compounded losses that go along with poor trading. Very few traders actually keep a trading journal or any form of report that can be accessed at a later date to perform analysis. Think about that for a minute. We use charts which are made up of historical prices to help predict what is capable in the future; why not do the same for our trading? In keeping a good record, you allow yourself the ability to come back at a later date and assess the trade when all emotions are removed. We suggest a 2 week period from the date the transaction was closed. Going back in and looking at your trades to find out what you did wrong is easy. When was the last time you looked at your trades and figured out what you did right? Take the time to diagnose your trades, find out what you did right, and replicate that time and time again.
One of the easiest ways is to get a notebook and a pen or pencil and keep tabs of your trades.

A full-time professional trader should spend AT LEAST 30 MINUTES A DAY journaling. An intermediate-term trader should spend at least two hours a week or more journaling. You should review your journal every 30-60 trades or every quarter, whichever comes first. By working every day to document the market's actions and your own actions, you will improve your understanding of the markets and of yourself.

Discipline

Trading is like a diet; you need discipline in order to be successful. Although this is the last topic I discuss it is probably the cog of the wheel in your journey to proactive trading. Over the years, I've seen traders (at least in their mind) come into my office and show me massive losses. Some of the losses could be attributed to not understanding the markets, but a majority of the losses were due to a lack of discipline.

Being a disciplined trader means following your system and sticking to it no matter what your feelings or thoughts are. If your stop-loss is at 30% and you hit that mark, then you methodically move onto the next trade and visit this loss in a couple of weeks when the emotions are removed. It is when you pull that stop and start looking at the chart for the next level of support that you get in trouble. Soon, that 30% loss is 50% and you are thinking about doubling down to dollar cost average. Before long you have amassed a 75% loss and doubled down. It is at this point that you begin to tell yourself that you will never do it again, hoping that your position will just get to break-even. There are numerous "systems" out there for trading and thousands of traders trade them. Why is it that some of the traders are successful and some fail? Discipline!

Conclusion

Hopefully you have a better understanding of the TESTED method and are prepared to become a proactive trader. The first step is to find a Target and figure out how long it will take to get there. Once you have the Target you can fine-tune your Entry using the ATR. Don't forget to place your Stop as that will remove the temptation of hanging onto a trade that you shouldn't. Hanging onto losers is what reactive traders do rather than prepare and accept that stops do get hit and trades do go against you.

As a proactive trader you have taken the steps and your Thoughts are clear and you fully understand how the trade works. About two weeks after you've closed the trade out you will want to go back and Evaluate it. This allows you to find the things you are doing well as well as the things you are doing that you shouldn't be. Finally, you must exercise Discipline throughout your career as a trader.


Things you can do from here:


Safeguarding Techniques

I am starting to like this guy just as much as Dr. Steenbarger. This is convenient since Dr. Steenbarger just announced that he is winding down his blog after 3 years or so and 3700 ish post along with three books, he is going to go work for some proprietary trading firm and will not be able to post as much.


Sent to you by Dominic via Google Reader:


via Psychtrader by Darren on 1/18/10

In Adlerian psychology there are what's known as safeguarding behaviors and they have a place in trading as well. Basically, we as humans want to protect ourselves from three threats to the self.

  1. Physical harm - we might get sick, die, etc.
  2. Social threat - we might not look good in the eyes of others.
  3. Loss of self-esteem - we might not look good in our own eyes.

What follows are the six primary safeguarding techniques that we all use to protect ourselves from the threats listed above.

Symptoms

Developing symptoms provides an opportunity to avoid an instance where one might feel threatened. As an example, if I were to get a headache on Sunday night knowing that the markets were open the next day and I've been short during a 40 point bull run.

Nobody enters a trade hoping to lose money. Rather, we all trade to win and that's what successful traders strive for. If headaches, fatigue, day-dreaming or other symptoms manifest themselves regularly then perhaps a little self-analysis is in need.

Excuses

We are typically aware of the excuses we use and everyone has a favorite. Often times as traders we fall prey to this "if only" game and it can be debilitating. As an example, I might find myself saying "if only the FOMC statement wasn't so hawkish I wouldn't have lost so much money."

Excuses are most likely done consciously whereas symptoms may be more from the unconsciousness. Therefore, the key is to recognize excuses that you might be throwing out there that are hindering your ability to succeed in trading. Take charge of your own actions and be accountable for each trading decision you make.

Aggression

There are several ways that aggression can manifest itself in life and it's typically a secondary emotion. Depreciation is where we might put others down to make ourselves feel better. Accusations are a common form of aggression. Self-accusation and guilt are a few other examples. The point is that aggression is a no win situation in which objectivity is often tossed out the window. Trading on emotions is one of the worst things you can do.

In poker, when a bad beat has occurred, the player has the tendency to become aggressive and seek revenge. This is often referred to as playing on tilt and the same thing occurs in trading. A certain stock took us for a few dollars and we might cuss at the monitor or throw the mouse. Next thing you know, we're back in their looking for a new entry and probably armed with twice the trade size that should be used.

Aggression is common and it's not a bad thing to be aggressive. In fact, aggression is needed to be successful in trading. The key is that you don't want it to become debilitating and causing you to trade on tilt. Focus on aggression more as fuel rather than a force as you need to be in control and work the throttle.

Distance Seeking

  • Relating to movement, we can find ourselves doing some pretty bizarre things when we step back and take a look. Here are a few "styles" of distance seeking that we all might have seen once or twice.
  • Backward movement-actually moving away from the challenge. The inability to step off the curb and pull the trigger on a trade.
  • Standing still-entails buying time. As an example we might not have all 483 indicators lined up correctly to place the trade.
  • Hesitation-failure to pull the trigger again, but more from a procrastination standpoint. Maybe the account hasn't been funded yet. OK, but ask yourself why it hasn't been funded and perhaps you can get at the root of the need for distance.
  • Creating obstacles-examples of this distance seeking tactic would be waiting for outside variables to hinder your trading. I need to get that 42 inch monitor so I can see the charts better.

Anxiety

In my tenure as a therapist I dealt with clients who had debilitating tendencies that were often related to anxiety. What's a better way to safeguard self-esteem than to become so afraid of life, people, etc. that you can't even function. By taking the time with my clients to find out what it was they were trying to avoid they were able to manage their anxiety without meds.

As a trader we can become so anxious about losing money or having others know about our losses, etc. that we choose not to trade at all or trade poorly. One of the basic tenets of Adlerian psychology is that we all strive for perfection or superiority. As traders we sometimes put undue pressure on ourselves by saying things like " I need to make $800 per day trading to meet my outflow." What happens when that "goal" isn't met? The result is often times manifested in performance anxiety and once again objectivity has left and larger than normal trade sizes start to appear. All the while striving for that $800 daily goal and the end result is anxiety.

Exclusion Tendency

In order to avoid future events I look to narrow my approach to trading so I focus on fewer strategies or setups and become extremely rigid. The end result is that I may only make 1-2 trades a month and that puts a lot of undue pressure on those few trades to be successful. The rigid, inflexible trader is easily broken as they are unable to adapt to a changing market environment. Many of the above mentioned safeguarding tendencies will manifest themselves and it can be painful both to the account and the ego.

The inability to adapt to such changes finds traders trading what they feel rather than what they see. If I'm holding up 3 fingers and asking how many you see...the answer should be 3 and not you asking me to hold up 4 because you feel as though that's what I should hold up.

Conclusion

There's nothing wrong with not wanting to look like a fool in front of others or not ever wanting to lose on a trade although the latter is highly unlikely. What is wrong is if you perform some of these safeguarding behaviors and they themselves hinder your ability to trade objectively. Often times traders are unaware of all the baggage they bring to the market on a daily basis. Unfortunately, most have to take a sizable hit and reach for the proverbial "rock bottom" before they figure out that something has to change.

One of the most underused and often overlooked tools that any trader can use is the trading journal. I suggest that if you don't have one then get one now. If you do have one and don't use it, kick yourself in the pants and get busy. Learn, trade, grow, share!


Things you can do from here:


Re-framing


Sent to you by Dominic via Google Reader:


via Psychtrader by Darren on 1/12/10

As a former therapist, one of the areas I would focus on with clients is the way in which they would perceive their situations. Using a technique called re-framing; I would help them see their "problems" from a different perspective.  Often times, clients would be able to overcome roadblocks simply by combating their negative perception of situations. This was quick and a huge relief for my clients and similar techniques are used elsewhere.

psychiatry-couch

In my wife's marketing career she would work on value re-framing with products for the company she worked for. In other words, she would bring about new value to an existing product simply by finding a new market or context for that product. Drug companies often use this same technique during clinical trials of drugs where the drug didn't do A, but it sure did do B. Rather than scrap the research done on the drug; they simply market it as a solution to B.

How can this be used in trading? After a trade is completed go back in and diagnose the trade.  I suggest doing it several days after the trade is completed as this will help in bringing clarity as most emotions will be in check as time passes. Here are a few questions you can ask yourself as you diagnose your trades.

  • Was it an income trade or a business expense?
    • Did you practice proper risk management?
    • Was the income/expense larger than you expected?
  • What did you do right and what was done wrong?
    • Was your stop too tight and the stock ended up going the way you thought?
    • Did you exit too early and leave some money on the table?
    • Was the target met?
  • What would you have done differently?
    • Used a wider stop
    • Given a more aggressive target
    • Checked sector/market performance
  • What did you do that you would do again?
    • Used proper risk management
    • Used time (theta) to my advantage

Be honest with yourself and learn what you did wrong and, more importantly, what you did correctly. This process will allow you to discover new strengths and weaknesses that you might have. The idea is to focus on the positive and then negative. It's easy to focus on the negative so avoid doing that first but rather after you've built yourself up. Here's the key...Turn the items that you've deemed as negative into a positive light. It may be difficult at first, but worth it.

You might find that, over time, you are just no good when it comes to a certain stock or sector and thus you can avoid that stock/sector, etc.  As an example, I found out that over a period of time that some of my biggest losing days were Fridays; regardless of the asset. As a result, I turned that into a positive by doing two things-not trading on Fridays and doing core research instead. Both of these activities increased my equity curve!


Things you can do from here:


Trading Journals

This is exactly what we are doing with our blog. It is our electronic trading journal in addition to a virtual trading room.


Sent to you by Dominic via Google Reader:


via Psychtrader by Darren on 1/8/10

alphabet

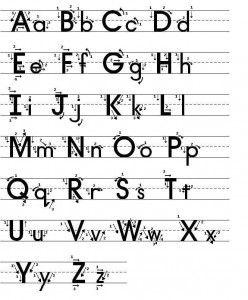
The image to the left should be recognizable by most of us as the American alphabet. It is from these 26 letters that billions of people are able to communicate on a daily basis. We learn the alphabet early on with rhymes and rote memorization so that we may contribute to society through our interactions. We all progress at different speeds, but eventually we all get to the point where we can recognize all the letters in the alphabet. It is at that point that we build upon that foundation and begin to spell words like C-A-T and T-R-E-E. These words are then combined to form sentences which consist of several words. From those sentences we form paragraphs and so on until we are able to write and communicate with others through pattern recognition.

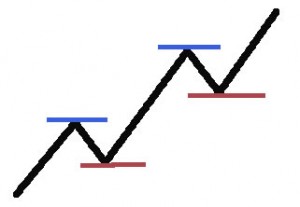
This ability of pattern recognition isn't anything new or even earth shattering--it's common sense. Just like the alphabet, which is in a pattern, we can discern the different patterns in lots of things. Take a look at the image below and you can recognize a pattern as well where there are higher highs and higher lows. Unlike the alphabet and some other patterns that have a beginning and an end, some patterns are continuous. Such would be the case for a chart that shows price action in a publicly traded company.

up

We could begin to see patterns in the line above and learn to predict or assume what has the higher probability of occurring next. As an example, looking at this pattern above we might safely assume that the odds are greater that the line will move lower from here as it has in the past. This does not necessarily mean that it will, but the odds are in the favor of such a move. It is this assumptive process that will serve not as an ends, but more of a means to and end. This pattern recognition assumes that the next move would be lower and thus helps us to proceed further. Information that we've gathered from the past can help us predict what the future may hold and this is the basic tenet of technical analysis.

Technical analysis can even be performed on your own trading account and patterns begin to emerge where you can recognize when your trading is "on" as your account grows and when the dollar amount pulls back you can assume that your trading is "off." This ability to recognize the patterns as your account fluctuates in price is a decent beginning, but nowhere near the wealth of information that can be gleaned from your trading history.

Trading journals are one of the most underused indicators that every trader has at their disposal. Why is it that such a powerful indicator is underused? I'd venture a guess that a majority of traders don't keep a trading journal because of the time it takes to keep one. I could be wrong, but over the years as I've mentored traders from all walks of life, time was the number one reason for failure. Second on the list was not knowing what a trading journal was so after reading this article, you now have no excuses as to why you don't keep a trading journal.

Below is a list of what I'd recommend to have in a trading journal and, as with anything in life, you'll get out of the journal what you put into it.

Date
Symbol
Position
Setup
Current Market Conditions
Expectations
Price Target and Reason
Stop Price and Reason
Entry Time and Reason
Exit Time and Reason
Outcome Of Trade and Analysis

If you are able, ATTACH CHARTS TO ALL ENTRIES! Remember the pattern recognition? Something may not have stood out in the heat of the moment, but several weeks later you may see similar chart patterns to this one. It is at that time that you begin to find common threads and themes of your trading which will allow you to exploit those things you do well and avoid those things you do poorly.

The above should be easily done and would suffice for the most part. However, if you really want to excel at this then a comment section is where the real clarity comes from as you listen to yourself. Take a moment and run through questions like this to get a better understanding of what's going of for you at that moment and document it. Here's some examples of what you could ask yourself:

Why did you allocate what you did to each trade?
Why did you enter the trade?
Did it meet all of your criteria?
Why did you trail the stop where you did?
Why did you exit when you did?
How is your percentage reliability of trades over time?
Does it fluctuate? If so, why?
What do you think about each trade as you make it?
Are you most nervous about your best trades?
Does your gut tell you anything consistently?
Which trades worked the best and worst?
Were there any common elements of your trades?
Are there blocks you notice that cloud your objectivity?
Are you making the types of returns that were your goal in terms of risk/reward?
Why or why not?

If you take the time to address questions like these then patterns will begin to emerge and you begin to understand yourself and your individual trading style. As I've said before, you need to treat trading as a business as doing so helps you control your emotions. It is impossible to not be emotional when trading but it is possible to control your emotions.

The last suggestion I would have is that you simply open up a blog and use that as your trading journal. There are several free services out there that allow you to create a blog and upload images, etc. The neatest thing about using a blog for your trading journal is the search function as each post or entry you make allows the use of tags or keywords. As an example, for every trade you make that is bullish, put the keyword bullish as a tag and later you'll be able to search for that keyword. With a few clicks of the mouse you can see every entry that you ever made in your trading journal that has the tag bullish in it. Take a few moments and read through them and start recognizing patterns.

Here's a few suggestions for resources that provide free blogs (in no particular order):

Write as often as you can in your trading journal and get into the habit of writing in it on a daily basis. When you close a trade, income or expense, take the time to capture your emotions at that point. A good idea is to come back and revisit your journal entries on a quarterly basis and add to them as you are now emotionally removed from them. You might even begin to sense a change in emotion as you read your prior entries...run with that and profit from recognizing your patterns.


Things you can do from here:


Core Ideas in Trading Psychology: Introduction to Trading Psychology

His post are always so relevant. I always take something away and can relate to many of his posts.


Sent to you by Dominic via Google Reader:


via TraderFeed by Brett Steenbarger, Ph.D. on 4/24/10

This post will begin a review of the key ideas from my three trading psychology books and the roughly 3700 blog posts on this site. Wherever possible, I will link to posts and resources pertinent to each topic for ready reference.

But first an introduction to trading psychology. The relevance of psychology for trading is based upon two important realities:

1) Trading is a performance activity, much like athletics or performing arts. Psychological variables influence both the acquisition of skills in any performance field and the application of those skills. While there is much more to performance than mindset alone--talents, skills, and interests must align--the wrong mindset can greatly hamper performance;

2) The human mind does not process information efficiently or effectively under conditions of risk and uncertainty. To simply "trade what you see" is a recipe for falling prey to a variety of cognitive and emotional biases. The trader's psychological development is crucial to learning how to properly gauge risk and reward when performance pressures mount.

Trading psychology is not something that is simply appended to trading practice: it is an integral part of functioning as a trader and is acquired in the process of learning how to trade. It is through the trader's developmental process that he or she learns how to manage risk, how to temper overconfidence and fear, and how to sustain positive motivation.

Indeed, a proper training curriculum for a new trader is one which helps the trader and the trading develop over time. A great deal of psychological learning comes from making the classic mistakes that bedevil all new traders: making impulsive decisions, allowing fear to overtake opportunity, overtrading, allowing losing trades to run and capping winners, and the like. If you can make those mistakes--and learn from them--long before you put the lion's share of your capital at risk, you will have an opportunity to grow into the trader you're capable of becoming.

Sometimes the best therapy for your trading is to get into therapy yourself. The markets are an expensive place to be working out your issues about success/failure, competency/adequacy, and need for approval/esteem. Many people take their repetitive patterns from family and romantic relationships and enact them in trading. When that is the case, psychological development needs to precede trading development: resolving those issues is the best way to approach markets with a clear and open mind.

Eventually, you will be able to take your psychological development to the next level of trading: you will recognize when others are making the mistakes you used to make. You will see markets acting on fear and greed and you'll be able to take the other side of those reactive trades. You'll observe when market sentiment is tilted one way and price can no longer sustain its trend. Developing yourself psychologically doesn't mean that you'll be free of emotion; it means that you will become increasingly competent at using your feelings as useful trading information.

More:

The Psychology of Trading is a good introduction to the topic of how life's challenges play themselves out in the trading world.

Enhancing Trader Performance is a good introduction to the learning curves of traders and the process of developing competence and expertise.

The Daily Trading Coach is a good compendium of self-help ideas and techniques for traders looking to coach themselves toward better performance.
.


Things you can do from here:


Thursday, April 22, 2010

Analysis on New Trades

I was really busy today and did not have the time to post the analysis for the 3 new trades that I added today.

1) PFE

This is a stock that I tried to play via long calls but got stopped out but noted in my post about the trade that I would be interested in selling puts should the stock continue to pull back further (Click Here to see Origninal Post). Needless to say I was stopped out of my long calls. Since then I have been stalking the possible put sales as I eyed Support levels at 16, 15.40 and a bigger level at 14. My bet is that the 14-16 range holds for this stock. So today I sold the 5 Jan '11 $15 puts for $1 which would put my breakeven at $14. So lets answer the questions in order:

Here are some questions that I want to answer: Is there an exit strategy should the stock rise? Why Jan 2011? You've never held anything that long. That's a maximum possible $1/$14 = 7.14% return for 9 months if you held until expiration, that hardly seems like the type of risk/reward that fits your trading style. You're tying up $7000 for a max reward of $500 9 months from now. So first let me address the return you calculated. Remember I calculate my risk/reward based on how much I am willing to risk vs. my reward. So for this particular trade my stop is set at 15.30, which gives me an estimated loss of about $215 on a reward of $500 or Risk vs Reward of 1:2.32, which in my opinion is acceptable. Next the capital tied up on this is not exactly $7,000. I know that there is a potential $7,000 commitement and I am willing to take possession if something catastrophic happens and I get exercised early, otherwise I will just get out of the trade if my stop is hit. So really the only capital tied up is the intial margin of about $1,400 (Put Price + Maximum((20% * Underlying Price - Out of the Money Amount), (10% * Strike Price))) to put this trade on. So really my return if I were to hold for the entire 9 months on a margin account would be 500/1400 = 35.7%. Which like we disccused last night could fluctuate a bit as the price moves up and down. I think that addresses your questions. Let me know if I missed anything and if it makes sense.

2) SPY

I bought 5 SPY puts to because I think that the maket is ready for a few distribution days. I liked IWO's analysis of the Lower Highs but wanted to be more aggressive with a straite put buy vs a put spread. So I looked for a position that would yield the same risk with the same stop but more profit potential. I am not making the bet that this rally is over only that it may be ready to rest and test some lower support levels. But I will stop out if 121.57 is breached + about .15 of wiggle room. I am ultimatley looking for a move between 116-118 as a downside target. Which gives me a profit range of 700-1400 with a risk of about $230.


3) DRYS to come

Wednesday, April 21, 2010

My time off!

Although I am not making any trades right now I am using my time off to look for possible trade ideas, Analyze my trading results from the past 6 months, and set goals for the next 6 months. I think it is a great exercise to not make any trades at least for a couple of days upon returning from vacation, it allows you time to get back in tune with the market which I feel like I am doing. Plus I am just not comfortable jumping into positions with the major indexes and stocks and new bull market highs. Here are some of the things I am looking for in the next few weeks to months:

1) A bid up in VIX, I do not think we are out of the woods yet. There could be more frozen twinkies out there like the GS that can provide reason for selling.

2) Commodities to run through the summer, especially oil.

3) The dollar to pull back in reaction to inflationary implications from a run in commodities.

4) A run in Commodities could finally show inflationary pressures from low interest rates and we could see the fed start to really consider raising interest rates, maybe we see a bump up in interest rates in the 4th QTR. But this is in my opinion only going to happen if we get that overheated run in commodities. Both of which could hurt stock prices.

I know these are not certainties but they are scenarios that I think are possible. But I am open to the fact that other scenarios could play out.

Also before the month is over I am considering taking the Market Awareness Profile. As we have all come to know trading is largely a mental game. The test is $100 and I am interested in it to see if I can glean any more insight from such a test. Check it out and see if it interest you. I will let you guys know if I decide to take it. I will also post the results.

Tuesday, April 20, 2010

A few trades and the psychological fallout

Yesterday I put on two new trades and before I could even make the time to post them I had already closed them out. The first was I sold May $17 puts on (BAC). I was tentatively looking for an entry point at $18 to write covered calls, but when it hit $18 yesterday I liked the price of the $17 puts at .38. I was more than willing to own at $16.62. So I sold 10 contracts, then this morning they are trading at .19 so I'm thinking I lock in 50% of the max gain in 24 hours with more than 4 weeks left until expiration. Though the original intention was to hopefully watch them expire worthless, once gain I changed my mind. But then shortly after I'm already questioning myself as to if I liked it when the stock was at $18, shouldn't I like it even better when it's at $18.50 and moved in my favor? I feel like having a plan doesn't mean anything if I'm going to over ride it 24 hours later.

I also did the (POT) put spread sale that I saw on the IWO market primer. I actually put it on myself Monday morning before he sent out an alert. Now here is where I go off the tracks again. So I can make a case that when you can take 50% of the max gain in one day and take off 100% of the risk that kind of makes sense, or at least I'm comfortable with that. But on this trade I only make about 40% of the max gain but I still took it off, not because of the percentages, but because the green box on my screen was flashing an unrealized gain of $300 and I wanted to lock it in. Here is where things get even crazier. One of the reasons I wanted to take both these trades off the books was because they added up to close to $500 and I knew I was going to have a dentist bill for about $500 today to get some fillings done.

This is just insane, complete mental masturbation accounting. The psychological aspect of what I do makes no sense to me. I don't know how I get passed the point of having a plan or a risk management thesis if I'm the one left to actually implement it. The actual fill prices of the POT trade only netted me $275 and not $300. When this happened I felt like I wish I had left the trade on. So I'm happy with a few booked trades with profits of about $450, but clearly there is still no method to my madness and there is a lot of work to be done.

Here is another area I need to address. Both of these trades today happened because I logged on during the day to see what was going on, I tend to do this more often when I have a trade on than when I have nothing on. Had I been busy today or not able to check, I wouldn't have cared. I looked at the closing prices yesterday and its not like I told myself that if if the stocks move in my favor a little bit today I'm going to close these out, but that's exactly what played out. I can make a counter argument that if I don't have time to fool around and look for opportunities sometimes, most of these trades wouldn't even happen in the first place. I think ideally I need to get to a place where I'm busy full time during market hours but make time each night to check in and make decisions when the markets are closed. I'm struggling to find a system of overall portfolio management and its frustrating me a bit.

6 month check point

In November of last year you may recall that I opened up an account with interactive brokers with $17,000 and my primary goals were as follows:

1) Develop a trading business plan. I do have a working document in place and plan to continue working on it over the next six months.

2) Learn as much as possible as well as try new strategies. I would have to say that the learning curve that I have tackled in the last 6 months, just amazes me. I have made more progress in the last 6 months than the whole 3 years I have been involved with the markets.
 
3) Remain profitable during the process. I actually set out a goal to make $500-$1000 a month not really knowing what to expect. As you will see below my total realized gain over the 6 month period that I set for myself came to $1,839 or 10.8% gain. I did not hit my target average monthly profit, but I nonetheless was able to remain profitable while learning a ton and trying out many different things.

Link to Full trading results for April


Lets take a more in depth look at my results for the period 11-2009 to 4-2010. First lets dial in on the profit by idea source. I paid for the premium subscription from IWO for education and idea generation. I also have some ideas that come from free sources T3 live and ONN.tv. The problem I have found is that I don't do very well just following other peoples ideas without making them my own. And although I have reigned in my impulse trades from my own ideas, I tend to be prone to make impulse trades off of their recommendations. And because they were not original ideas, A lot of times I have trouble managing them as they suggest. As you can see from the table at the right, my results clearly tell me that I am better off following my own trading ideas. And I think this makes sense because I put a lot more thought and analysis into my trades before I make them. So as of today 4-20-2010 I will only be making trades based on my own trading ideas. My current subscription to IWO will be for educational purposes only and for that it has been great.


Briefly here I would like to set a goal to have largest gain equal to my largest loss. Eventually I would expect that my largest gain would be bigger than my largest loss, at least that would be the goal overtime. Also realize in the summary of monthly results at the top of this page that February was my worst month and was also the month that I created and clearing defined the risk parameters to my overall trading plan.

Now lets focus in on my Win/Loss Rate and holding period. Here the % winners to % losers is about what I had expected. I had mentally thought that I had about a 60% win rate, and now I have the numbers to confirm it. But what I really want to dial in on is my average holding period and more specifically on the average holding period for my winners of 10.91 days. I have reviewed many trades after closing them out. What I had noticed in my winners is that I leave a lot of profit on the table. And I know why this happens, it is because I always remember the last loser I booked and am quick to book profits before they evaporate to cover my last loss. But from reviewing many of my winning trades after closing them I have noticed that with just an extra 5-10 days the profit targets that I set for the positions are realized and are usually 2-3 times larger than the profit I actually booked. In my calculation the results in thousands of dollars in low hanging fruit that with a few mental adjustments could be realized. So my goal over the next 6 months is going to try and hold those positions a bit longer when I am in a position of profit, in other words I will let my winners run. I think that I have done a good job cutting my losses and the average loss that you see in my opinion is skewed a little bit because of large losses that I took that under my new risk management system outlined in my trading business plan would not occur save any un-controllable event. What I mean is my risk management rules that I have in place would had stopped me out way before my losses got out of control. For example the largest loss from above of $1,040 would violate my maximum 3% of total portfolio risk, which at $17,000 would be $510. But I did not have this in place during the first few months of trading in this account.

That is really all I wanted to dial in on. But with that said I would also like to outline some new goals for the next 6 months:

1) Only make trades based on original ideas and analysis. Meaning I will only use IWO as educational source.
2)  Let winners run to capture low hanging fruit. This will most likely be seen with an increase in both my average gain as well as an increase in the Average holding period.
3) Largest gain to be greater than or equal to that of my largest loss. Overtime this will ideally be greater.
4) Make enough profits to hit my 15% annual return goal.  This means that I need to take my total gain from $1,839 to $2,550.
5) Continue to work on trading business plan.

Good Luck Trading!

Tuesday, April 13, 2010

TraderFeed : Anxiety in Trading: Limiting Profitability by Micromanaging Trades

Dominic Di Bernardo has sent you a link to a blog:

This is a must read. I know I have been guilty of this many times. This is actually something I am working on fixing as I try to be more and more "passively active".

Blog: TraderFeed
Post: Anxiety in Trading: Limiting Profitability by Micromanaging Trades
Link: http://traderfeed.blogspot.com/2009/01/anxiety-in-trading-limiting.html

--
Powered by Blogger
http://www.blogger.com/

Monday, April 12, 2010

Another 1,000 Points Under the Belt

Another 1,000 Points Under the Belt: "

The DJIA has traded above 11,000 twice now in the past two trading days, which was a level that hadn't been seen since September 2008. While there has been no shortage of discussion regarding the market getting ahead of itself, the 159+ days that it has taken the DJIA to clear the 10,000s range is actually longer than any of the other four 1,000 point ranges it has already cleared since the March 2009 lows.


In the table below, we highlight the duration (in trading days) that it took the DJIA to clear various 1,000 point ranges on the way down during the bear market and on the way up during the bull market. For example, on the way down, the period of time that the DJIA last closed above 14K to its first close below 13K spanned a period of 21 trading days. If you think that was fast, the drop from its last close above 10K to its first close below 9K only took four trading days!


As is typically the case, the market's declines were a lot swifter than the subsequent advances. While it only took four trading days for the DJIA to clear the 9000s on the way down, on the way up it took 59 trading days. As shown, the only 1,000 point range where the DJIA was faster on the way up than it was on the way down was its move from 7,000 to 8,000. On the way down it took 69 trading days, while the way up only took 17 trading days.


"

Reflections on the Kent State University Program in Financial Engineering: Investing in Your Career

Reflections on the Kent State University Program in Financial Engineering: Investing in Your Career: "I had the pleasure today of talking with graduate students from the Kent State University master's of science program in financial engineering. They were interviewing for internship positions at trading firms; those internships can eventually lead to full time positions with proprietary trading firms, hedge funds, and investment banks.

I can't begin to tell you how impressed I was with the students. They blend analytical abilities, strong teamwork skills, and a sound work ethic. Most of all, they are learning tomorrow's skill sets today.

The Kent State program is unique in that it combines a quantitative and analytical focus with practical trading skills. The program operates a trading floor on site and provides students with experience in trading a variety of markets. Guest speakers from the financial industry visit the students and provide real-world insight and members of the board of advisers (which I am one) help the students find promising internships and jobs.

When these students graduate, they will have significant skills in statistics, programming, and financial modeling. They will be able to test trading ideas, develop trading systems, and manage the risk of individual positions and diverse portfolios. They will also have the training in economics to help them identify global risks and opportunities.

Personally, if I were a young person starting out a trading career, I would seek out this kind of training. There is a vast world of trading activity and opportunity that you never read about in the popular magazine articles and books on trading. There are cutting edge skills you can learn to help you identify and profit from these opportunities.

Invest in your education and you will see a significant return on that investment. While education in the world of finance is not cheap, a lack of education can prove particularly expensive.
.
"

Wednesday, April 7, 2010

Bespoke's Sector Snapshot

Bespoke's Sector Snapshot: "

Below we highlight our 6-month trading range charts for the S&P 500 and its ten sectors. The Materials sector is the most recent one to take out its prior 2010 highs. Now six of the ten sectors are trading at new bull market highs. The defensive sectors -- Health Care, Utilities, and Telecom -- are still below their prior highs, along with the Energy sector. Financials, Industrials, and Consumer Discretionary have really left their prior trading ranges behind in recent weeks, but one has to wonder how long this recent push without even a minor pullback can last.


Want more actionable advice from Bespoke? Subscribe to Bespoke Premium today.

"

Growing Your Trading Size: How to Take More Risk

Growing Your Trading Size: How to Take More Risk: "A developing trader recently asked me one of the most common--and important--questions that I encounter: How do I become comfortable growing my size and taking more risk?

One advantage to starting out trading small is that you have the time to make all your mistakes without wiping yourself out financially. Many traders take imprudent levels of risk early in their development and never survive their learning curves.

But learning to trade small has its downfalls. Once habituated to a given level of risk and reward, we can find it difficult to adjust to the much larger dollar volatility of returns when we trade larger. Nothing is more discouraging than making money over an extended period trading small, only to give it all back in a few losing trades once size is increased.

That larger size, increasing the dollar size of both wins and losses, can also magnify emotional responses to performance. Ironically, this can be as problematic after large wins as after large losses.

Three principles should dictate your trading development vis a vis the size and risk issue:

1) If a bump up in size *feels* much different to you, it's more likely to impact your trading adversely. Gradual increases that you adapt to thoroughly before bumping up your risk again can help you grow into a large trader naturally;

2) If you're not profitable and trading well at incrementally larger size/risk, don't bump up the size/risk further. Make sure you're trading well at your current level before expanding your business;

3) Follow your percentage P/L, not your dollar P/L. Get yourself accustomed to thinking in basis points (hundredths of a percent) and percents, not in absolute dollar amounts. That way, when you're down 50 basis points in a day on a $5,000,000 portfolio, it won't feel significantly different from being down 50 bp on a $500,000 portfolio.

In percentage terms, trading larger doesn't have to mean taking more risk. The key is risking a fixed portion of your portfolio value each trade, each day and growing your size as your portfolio grows. That will also have you cutting your size when you draw down.

Just remember: at some point, you *will* encounter strings of losing trades. Make sure your larger size will not dig you into a damaging hole when the inevitable slump occurs. Too many traders focus on trading big, when their proper focus should be on trading bigger.

.
"

Tuesday, April 6, 2010

42 Days and Counting...

42 Days and Counting...: "

It has now been 42 days since the S&P 500 has had a pullback (one-day or multi-day) of 1%. Since 1990, there have been 10 other periods where the index went 40 days or more without a 1% pullback. The table below highlights these occurrences.


The S&P 500 is up 8.75% over the last 42 days. As shown, the number of days without the 1% pullback ranges from 40 to 70, and the price gain ranges from 4% to 9%. So while there have been longer periods of time without a 1% pullback, the current gain of 8.75% without a 1% decline is at the top end of the range over the last 20 years. Interestingly, once the streaks ended, the decline of 1% or more never got worse than -2.53% before another gain of 1% or more occurred.


Want more actionable advice from Bespoke? Subscribe to Bespoke Premium today.


"

Reading Less, Practicing More & Getting Experience

 
I found this at The Kirk Report and thought you may be interested:

http://www.thekirkreport.com/2010/04/reading-less-practicing-more-getting-experience.html


Dominic

S&P 500 & All Ten Sectors Overbought

S&P 500 & All Ten Sectors Overbought: "
The chart to the right highlights the current levels of the S&P 500 and its ten sub-sectors relative to their trading ranges. The chart is included each day in our Morning Lineup, which is available to all Bespoke Premium subscribers. For each index or sector, the circle represents the current level while the tail represents where the index or sector was one week ago. The light red and green regions represent between one and two standard deviations above (or below) the 50-day moving average (DMA), while the dark red (and green) shading represents more than two standard deviations above (or below) the index's 50-DMA. As shown in the chart, the S&P 500 and all ten sectors are currently trading at overbought levels, so the recent strength in equities has been a tide that's lifted nearly all boats. To further illustrate this point, we would note that as of yesterday's close 92.4% of the stocks in the S&P 500 are trading above their 50-DMA while 77.4% are overbought (1+ standard deviation above 50-DMA).

To receive access to the Morning Lineup, and the rest of the Bespoke Premium package, subscribe now for just $1 per day.
"