Thursday, August 19, 2010

Final Earnings Season Stats

Forget the first chart, earnings are easily manipulated and most of the earnings beats were and have been driven by cost cutting measures. The real chart that people should be focusing on is the top line. You can see that we may be starting an alarming trend with 3 consecutive quarters of declines in the number of companies beating on the top line. There is only so much you can cut...Eventually you have to grow sales.


Sent to you by Dominic via Google Reader:


via Think BIG by Bespoke on 8/19/10

Earnings season ended this past Tuesday with Wal-Mart's report, and below we highlight the final tally for companies that beat both earnings and revenue estimates.  As shown below, 65.8% of companies beat earnings estimates, while 63% beat revenue estimates.  The earnings beat rate was higher than last quarter but lower than the three quarters prior to that.  The revenue beat rate was lower than last quarter, which was weaker than the quarter before that.  Earnings numbers started out very strong, but by the end of earnings season, the numbers were just about inline with prior quarters over the last year or so.  As we're seeing today, investors have moved on to economic numbers, and they aren't too pretty right now.

Want actionable advice from Bespoke?  Subscribe to Bespoke Premium today.


Things you can do from here:


Wednesday, August 18, 2010

8-18-2010 Futures Technical Update!

RBOB continues to be week and after an the anticipated rally to work off oversold conditions we are seeing it continue its journey lower trading down almost 2% as I write this. On top of that Crude has broke an important support level at $75 after the API reported a build of almost 6 million bbls in the U.S. In yesterdays update I had said that /HO was not setting up as bearishly as /RBOB and still had a strong support level intact around 1.98-2.00 and that it was likely that we saw 2.06 before we saw the 1.98 again, I was wrong here. However /HO support still remains intact at 1.98 and unless this level breaks we should see high prices.

/HO
I think that support holds at 1.98 and the next target to the upside is 2.02 and then 2.05.


/RBOB
I hold my bearish stance on /RBOB and it continue to make lower lows on it latest down trend started 8-4-10 and believe it will be testing its May low of 1.88 very soon. If we get some real momentum to the downside in equities it could happen this week.


/CL
Last week crude had a sell off of better than 7% and continues to look week. Today after the API report last night crude is off about 2% and broke an important support and in my opinion physiological level of $75. This one is setting up identical to /RBOB and I have a downside target of 72-72.50.


On the economic and news front, today is a very light day. I will re-iterate that I believe yesterdays move up in equities, /CL, and /RBOB was just an oversold rally only to set up for a move lower. As we finish up the tail end of earnings season the market is running out of much catalyst to propel it to the upside and I remain bearish through the rest of the summer and into September.

Tuesday, August 17, 2010

Started a new Short in SPY at 110

Today the markets are getting a nice bounce and I want to be short. The SPY is currently trading at 110.06 as I write this post. I purchased 1 Sep $110 put for $3 and will look to add to my short via 113/114 bear call spreads if we get up there. I think that this market is in the process of putting in yet another lower high, see chart below:


Series of Lower highs:

1) The high for the year is set at 122.12 made in April.
2) Late April we sa a lower high put in at 121.05
3) We then sold off during the first half of May and put yet another lower high after rallying off of the May lows at 117.5
4) After reaching 117.50 in May the selloff making new lows from the prior selloff which followed by another attempt to rally in June to a new lower high of 113.20.
5) The rally in June was followed by yet another selloff to new lows into July, which July saw yet another impressive rally that continued into August only to test the 113 level several times before selling off again.
6) TBD, I think that the market is in the proces of putting in yet another lower high around the 110-111 area on the SPY.

These techicals coupled with the move in bond prices I think are lining up for a nice selloff. We are seeing rates near lows during the worst of the finacial crisis, yet the major indexes are far from the same lows that coisided with current rate levels. Although I do think bond prices are a bit overdone so does the rest of wall street so they will probably continue to higher prices before falling back down to earth.

Are treasuries the next bublle to pop? How much lower can rates go? How long can they stay at these levels? These are all questions that I keep in my mind, because I want to be ready to expoit the TLT for some profits on either side.

Position:

Like I said I bought 1 Sep $110 put at $3 and will look to add to my short position via 2 bear call spreads near 113 if we get there.

Learning to keep my position size very small.

Also keeping my eye on TLT for possible bullish play in short term and bearish play further out in time.

That is all for now!

Monday, August 16, 2010

Lets do the LImbo...How low can you go?


Sent to you by Dominic via Google Reader:


via VIX and More by Bill Luby on 8/16/10

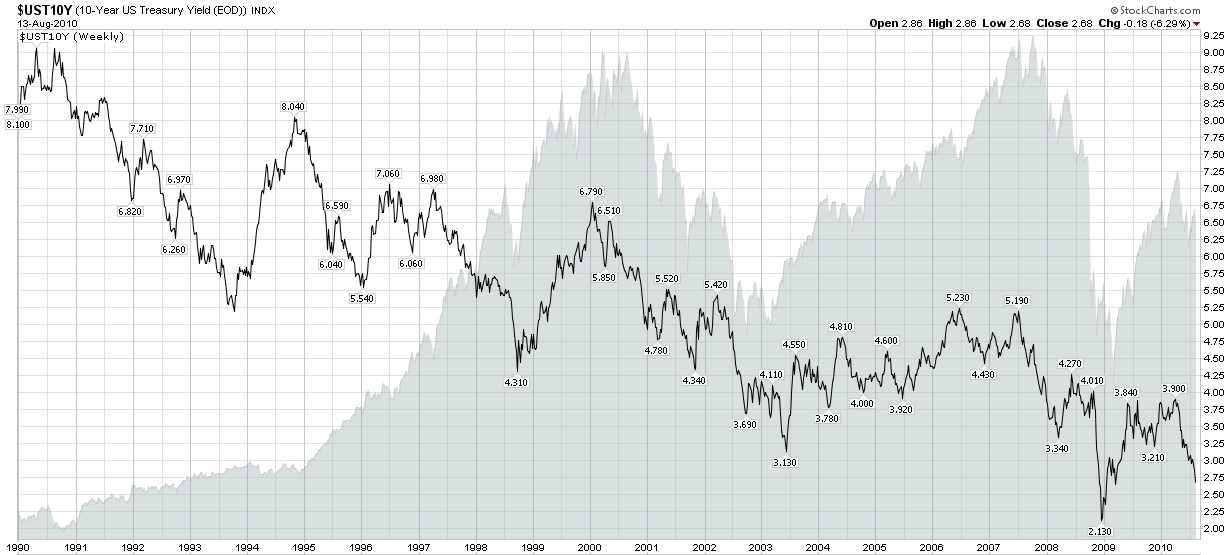
5The speed with which the yield on the 10-Year U.S. Treasury Note dropped from just over 4.00% in early April to just 2.68% as of Friday's close is astonishing – and points to how the bond market is evaluating the prospects for deflation, recession and a prolonged economic malaise, or worse.

This week's chart of the week captures the history of the yield on the benchmark 10-Year U.S. Treasury Note since 1990, when it was hovering in the vicinity of 9%. For additional context I have also included a gray area chart of the S&P 500 index. More often than not, yields on the long bond are positively correlated with equities, but this relationship can decouple, sometimes for an extended period of time.

Those who are interested in the history of the yield curve and may wish to experiment with an interactive tool with yield curve data going back to 1977 may wish to click through to Fidelity's Historical Yield Curve page.

Related posts:


[source: StockCharts.com]

Disclosure(s): none


Things you can do from here:


Sunday, August 15, 2010

Going to Play...But very Small!

I have been out of the markets for what seems like an eternity...I think it has really only been about 3-4 weeks, I do not know for sure. I need to stay focused on the new job, but I also need to make some small plays here and there to continue the learning.

So as we end the most recent earnings season I think that the market lacks any catalyst to make any new highs this summer and that 113 is the top that has held in June, July, and August. The market still has many issues to work through and as we continue to get feedback from different leading and lagging indicators, we are continually reminded that growth is slowing and that the numbers are not indicative of a normal recovery to end a recession. Slowing growth was to be expected after the initial bursts from all the stimulus and bail out money that hit the markets. I am still in the camp that we go lower in the short term before we go higher. These problems can't and have not been fixed in a year. It took many years to get in this mess and we have only put band aids over the problem time and again.

Anyways take a look at the most recent price action from the SPY the past few days after testing that 113 resistance level and after an impressive ralley off the July bottom near 101.50. I think selling is coming back to the forefront and will at least until the next opex in September if not until the next earnings season.


I think the selling will lead to cash flowing from risk assets like equities and into "safer" treasuries. This move may or may not be exaggerated causing a further up move in TLT. Either way I think that TLT will at least remain stable at current price levels as long as we stay under 113 on the SPY. To take advantage of this I want to sell the 100/98 Sep '10 Call spread, currently trading for $0.50.


Like I mentioned in the above post title I am going to keep any trades I do very small (1-3 contracts). To start the position I am only going to sell 1 vertical spread and look to add up to 2 additional spreads. A solid close above 113 on the daily chart would get me out of this trade.

Saturday, August 14, 2010

Must read Book...and a little commentary!

This is my first post in sometime and it will not have any actionable trade ideas. But I think it is worth sharing my thoughts.

Anyone with an open mind or any interest to be intellectually challenged about the future, and the role that America will play in the global arena, needs to read Fareed Zakaria's book "The post-American World". Fareed does a great job painting a picture of how America has achieved great success politically, militarily, and economically over the past few hundred years. He goes further to explain the role that America has played in shaping the world as we know it today. Since America's great rise the world has become more interconnected then anytime in history. Although America has remained THE SUPERPOWER for many decades, a global world is presenting challenges that will need America to remain nimble and open to change. With rising nations like China and India with over 2.5 Billion people America is faced with new challenges and must acknowledge these nations and their desires. Gone are the days that America defines all policy's as to how the world should look and operate. Although we have had a great influence and have played a major role in the rise of the other countries we have to realize they may not have the same goals as we do.

As a superpower the U.S has experienced much prosperity and has wanted to share the American dream with the rest of the world. But at some point you have to draw a line between sharing and force feeding your beliefs on other nations. With powers such as the U.S garners it is very easy to become imperialistic, which when looking back on history has not fared very successful in the long run. The U.S has to acknowledge that the world has changed and that we must change with it, if we want to remain a important player. We need to collaborate and open our borders, not isolate ourselves from these rising nations. During the countries great rise it was because of this openness to race, religion, immigration, free trade, etc., that has led to the vast prosperity that this country has experienced.

If we wish to continue to be respected as a world power gone are the days of "do as I say, not as I do", if we wish to set policy that the world should operate under, then we too need to follow them. But they need to be formed with representation from the rest of the world as well. And yes there will be compromise, the American way is not always the right way, as shocking as the may sound.

Don't get me wrong, I love America and believe in our ideals. But I think that everyone can take a step back and realize that just like people countries make mistakes too. I think that America is more then capable of making the necessary changes to remain a super power in the global arena among the "rising rest" that Fareed Zakaria talks about in his book.

We have many issues on our plate now that will take time to work through, and we may have to feel a little pain as a nation to get through them, but we will come out stronger because of it.

I am bullish the United States in the long term and I sincerely believe that we will make the right decisions as a nation that will propel prosperity in this country and the rest of the world for generations to come. Just realize that it is not going to happen overnight.

With that said go read "The Post-American World" by Fareed Zakaria.